
Fig. 2.
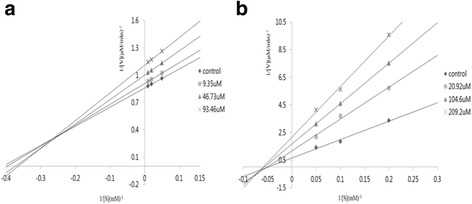
Lineweaver-Burk plots of the inhibitory effect of compounds on PTP1β -catalyzed hydrolysis of pNPP, respectively. Data are expressed as the mean substrate concentration of compound 7 (a) and 11 (b)
Official websites use .gov
A
.gov website belongs to an official
government organization in the United States.
Secure .gov websites use HTTPS
A lock (
) or https:// means you've safely
connected to the .gov website. Share sensitive
information only on official, secure websites.
Lineweaver-Burk plots of the inhibitory effect of compounds on PTP1β -catalyzed hydrolysis of pNPP, respectively. Data are expressed as the mean substrate concentration of compound 7 (a) and 11 (b)