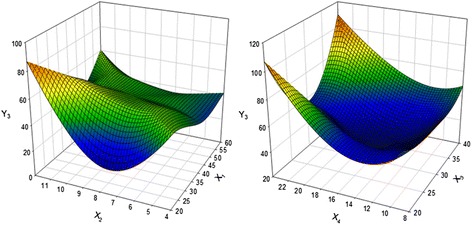
Fig. 4.

Response surface plot for the effects of extraction temperature, extraction time, solvent-liquid ratio, and solvent volume on total anthocyanin content of extract. (X1, extraction temperature (°C); X2, extraction time (hour); X3, Solid-liquid ratio (%); X4, solvent volume (1:X); Y3, total anthocyanins content (mg C3GE/100 g))
