Fig. 1.

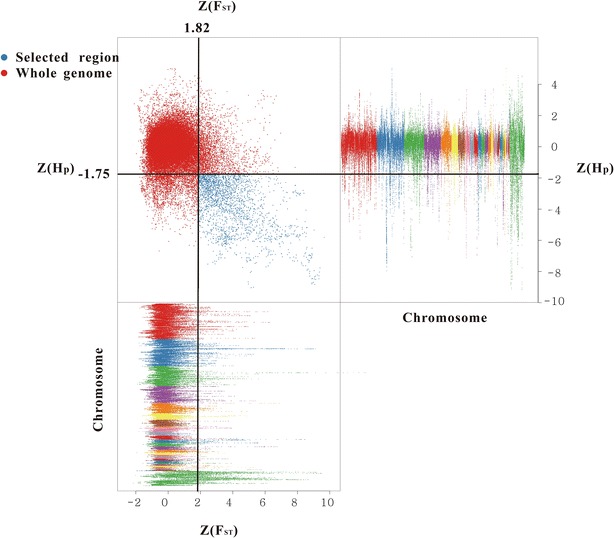
Distribution of and calculated for 100-kb windows sliding in 10-kb steps. Blue points identify Xishuangbanna game chicken (YNLC) genomic regions with both an extremely low value (top 5 % level) and an extremely high value (top 5 % level)

Distribution of and calculated for 100-kb windows sliding in 10-kb steps. Blue points identify Xishuangbanna game chicken (YNLC) genomic regions with both an extremely low value (top 5 % level) and an extremely high value (top 5 % level)