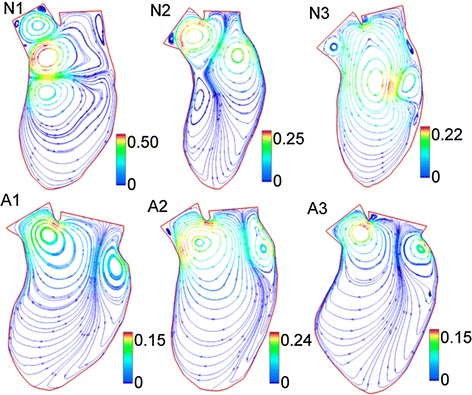
Fig. 5.

Comparison of intraventricular flow patterns in a normal subject and MI patient. The figure illustrates the streamlines at the end of diastole for normal cases (N1, N2, N3) and abnormal cases (A1, A2, A3). It can be noted that more vortices are generated in the normal LVs. It is seen that the inside of the LV cavity is dominated by a big vortex in the N3 case and all other abnormal cases [17]. (Reprinted from [17], with permission from Elsevier)
