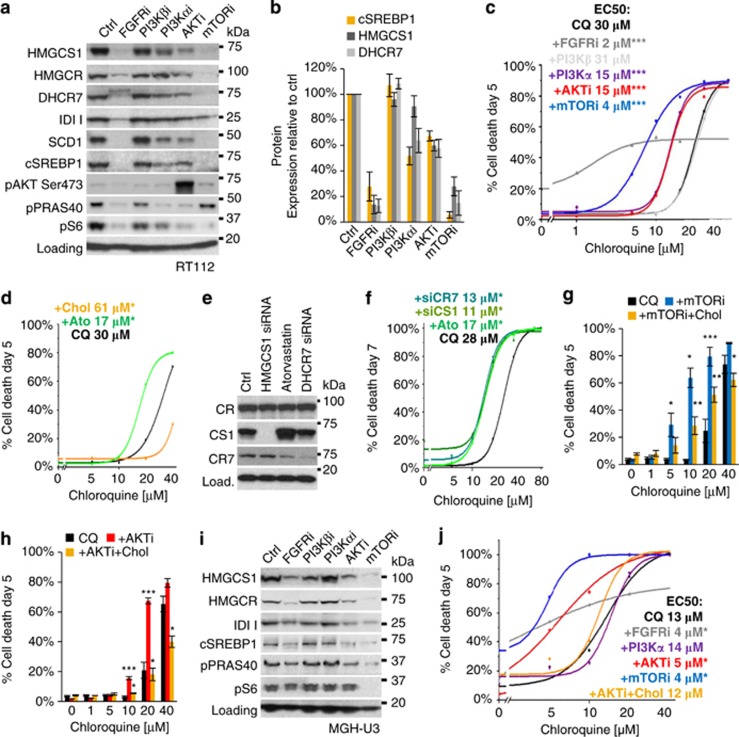
Figure 4.
Inhibition of cholesterol metabolism underlies synergy between CQ and AKTi or mTORi. (a) RT112 were treated with FGFR/PTENi for 3 days and immunoblotted for the expression of enzymes regulating cholesterol and fatty acid biosynthesis pathways and quantified in (b) (n=3; mean±s.e.). (c) RT112 cells were treated with inhibitors to FGFR (0.25 μm), AKT (1 μm) and mTOR (0.25 μm) for 5 days in combination with CQ (1–40 μm). Line graph shows OriginLab curve fitting based on data points generated in >3 independent experiments. Inset text shows EC50 values and statistical analysis for each treatment. (d) RT112 cells were preincubated with Ato (5 μm) or water-soluble cholesterol (Chol, 10 μg/ml) for 6 h before the addition of CQ (1–80 μm). Line graphs were curve-fitted using cell death data from three independent experiments at each data point. (e) RT112 cultures were reverse transfected with siRNA targeting HMGCS1 or DHCR7 for 72 h or Ctrl siRNA and incubated with or without Ato for 24 h. Immunoblotting shows expected protein knockdown by siRNA (n=2). (f) Cells were transfected as in (e) and treated with CQ (1–80 μm) from days 2 to 7. Line graph shows curve-fitted data from three independent experiments. (g and h) RT112 cultures were preincubated with Chol (10 μg/ml) for 6 h before the addition of mTORi (0.25 μm; g) or AKTi (1 μm; h) and CQ (1–40 μm) for 5 days. Histograms show the quantification of cell death from four independent experiments. Statistical analysis on blue (mTORi+CQ) or red (AKTi+CQ) bars reflects comparison of means to CQ control (black). Statistics on gold bars (+Chol) reflects significance to red and blue bars at each concentration of CQ (i.e. protection by Chol against combination treatment) (i). MGH-U3 cells were treated and immunoblotted as in (a). (j) MGH-U3 cells were treated as indicated and cell death quantified and curve-fitted to generate EC50 values (data from one experiment is shown; n=3; statistical analysis by Student's t-test on data at 10 μm CQ). *P<0.05, **P<0.01, ***P<0.001.

