
Fig. 5.
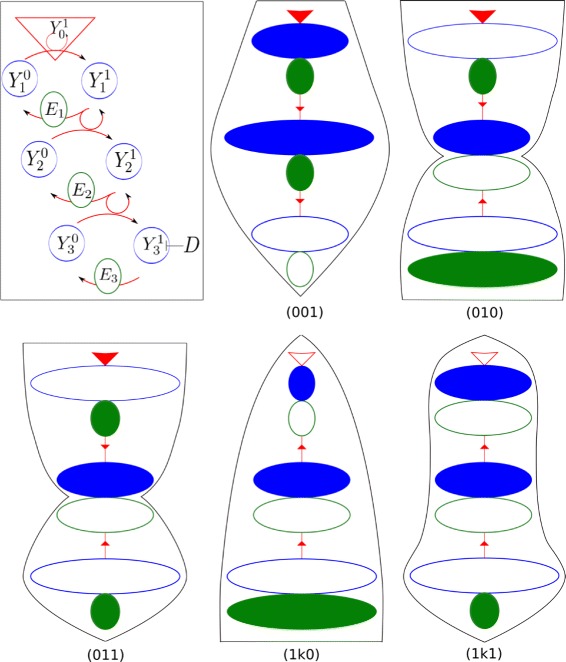
Motifs representing qualitatively conditions on the cascade’s main parameters (top left) optimizing the likelihood of each signaling regime. Graphical codes for the biochemical species: the triangle corresponds to input signal , the ellipses to total proteins Y iT or total phosphatases E iT, and the number and direction of the arrows on the segments represent the intensity of cycle activation (if downward arrows) or cycle deactivation (if upward arrows). Color: blue is for kinase, green for phosphatase; size: total concentration of the species; texture: shaded means saturated, empty unsaturated. Drawing of motifs is detailed in Additional file 3