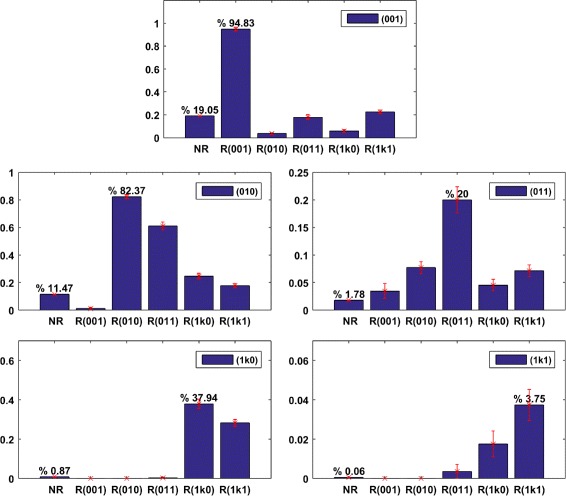
Fig. 6.

We consider the 5 signaling regimes corresponding to motifs of Fig. 5, as well as associated parameter restrictions characterizing each of them (see details in Discussion). Then, each panel displays the probabilities of a given signaling regime in function of the considered parameter restrictions. Consistently, the probability to get a given signaling regime is maximized by choosing the parameter restrictions characterizing it, and this maximum is significantly higher than the probability obtained from a log-uniform distribution of biochemical parameters without any restriction (cf. first bar of the histogram, NR)
