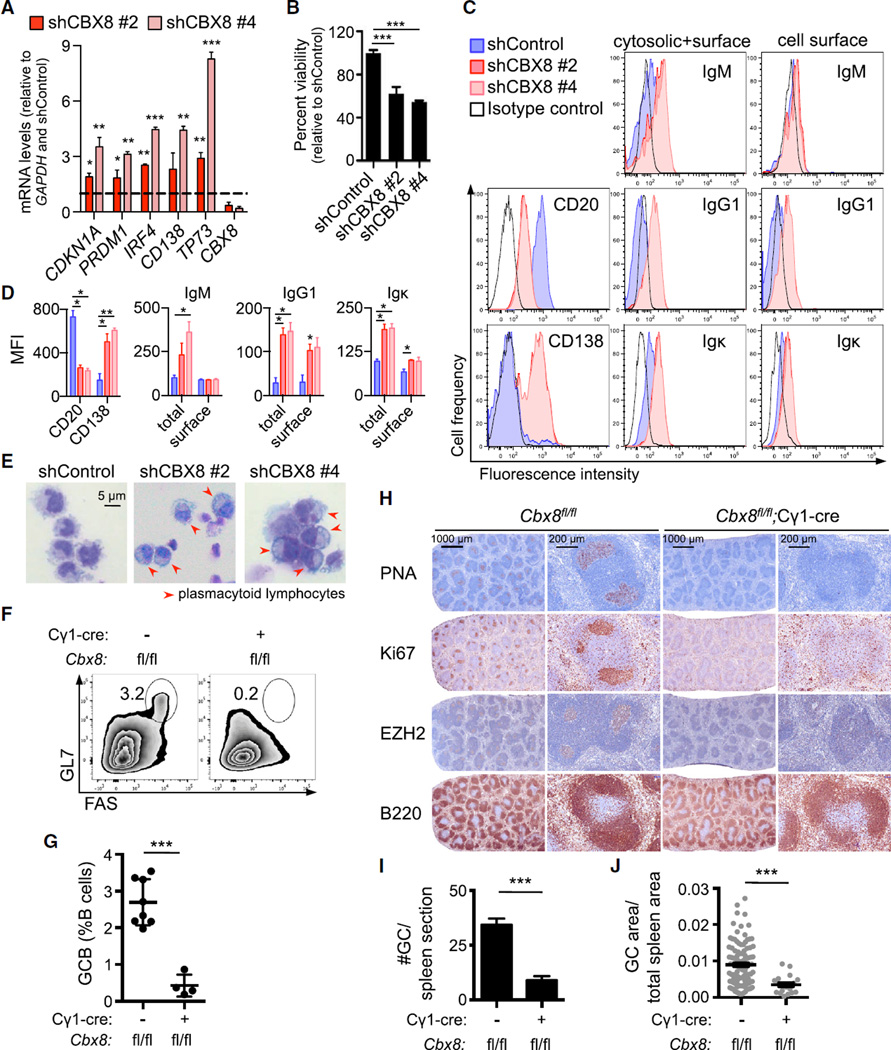
Figure 7. CBX8 Phenocopies the EZH2 Loss-of-Function Phenotype In Vitro and In Vivo.
(A) RT-qPCR of the indicated mRNAs from OCI-Ly7 cells expressing two independent CBX8 shRNAs or control used in Figures 6H and 6I. p Values shown are compared with the shControl.
(B) Viability of OCI-Ly7 cells from (A) was evaluated 7 days after infection using cell titer blue.
(C) WSU-DLCL2 cells were infected with two independent CBX8 shRNAs or control for 5 days, and CD20, CD138, and immunoglobulin (Ig) expression levels were examined by flow cytometry.
(D) Quantification of mean fluorescence intensity (MFI) from (C) (n = 3).
(E) Representative images of WSU-DLCL2 cells infected as in (C).
(F–J) Cbx8fl/fl (n = 8) and Cbx8fl/fl;Cγ1-cre mice (n = 4) were immunized with SRBC and sacrificed 10 days later. (F) Representative flow cytometry plot of splenic GC B cells as in Figure 1A. (G) Quantification of GC B cells by flow cytometry as in Figure 1B. (H) Splenic tissue was stained for PNA, Ki67, EZH2, and B220. (I and J) Quantification of GC number (I) and area (J) based on PNA staining in (H).
Values in (A) and (B) are shown as means of triplicates or quadruplicates ± SD. Values in (D), (G), (I), and (J) are means ± SEM. t test, *p < 0.05, **p< 0.01, ***p < 0.001. See also Figure S7.

