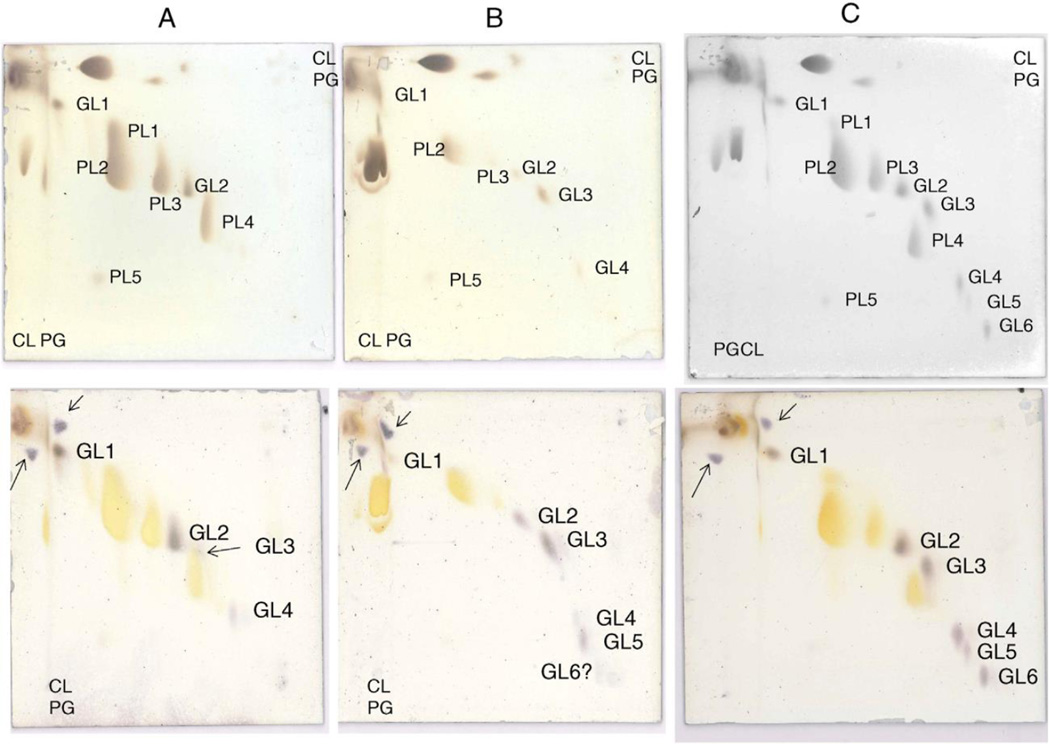
Fig. 1.
Analysis by 2D-TLC of lipids from: A) R. lituseburensis, B) R. ilealis, and C) strain FRIFI. The upper plates were stained with ninhydrin and after recording, with molybdenum blue followed by charring and the lower plates were stained with α-naphthol. The major lipids were identified by their staining properties and confirmed by LC/MS as follows: PL1, PG; PL2, CL; PL3, PG; PL4, lysyl-PG, and PL5, PA. The glycolipids were initially shown by staining with α-naphthol and their identities revealed by LC/MS as follows: GL1, MHDAG, GL2, DHDAG; GL3, acyl-TriHDAG, GL4, TriHDAG; GL5, acyl-TetraHDAG; and GL6, TetraHDAG. Lysyl-PG was ninhydrin-positive. Standards of PG and CL were applied to the left margin and in the upper right hand corner, upper plates and a standard of MHDAG was applied to the left margin and upper right hand corner of the lower plates stained with α-naphthol. The resulting spots are shown with arrows.

