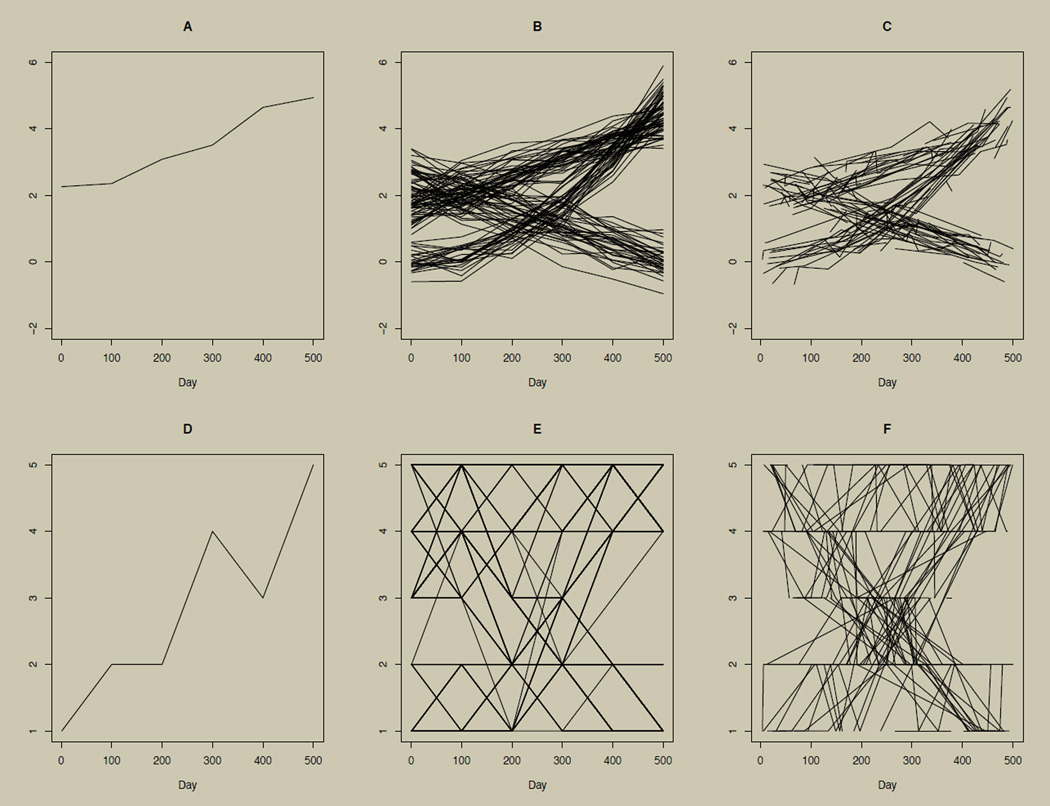
Figure 2. Growth curve illustrations using continuous and categorical data.
Growth curve illustrations using continuous data (panels A–C) and categorical data (panels D–F) from n = 5,001 simulated individuals. Data for D–F are categorized versions of data in A–C, cut such that the sorted data are binned into five approximately equally sized categories. Panels A and D illustrate the growth curve for one participant. Panels B and E illustrate growth curves for many participants. Panels A, B, D, and E show data collected at 100-day intervals for a total of six time points. Panels C and F illustrate growth curves for many participants with individually varying times of observation and individually varying numbers of observations (in this case, from two to six observations).

