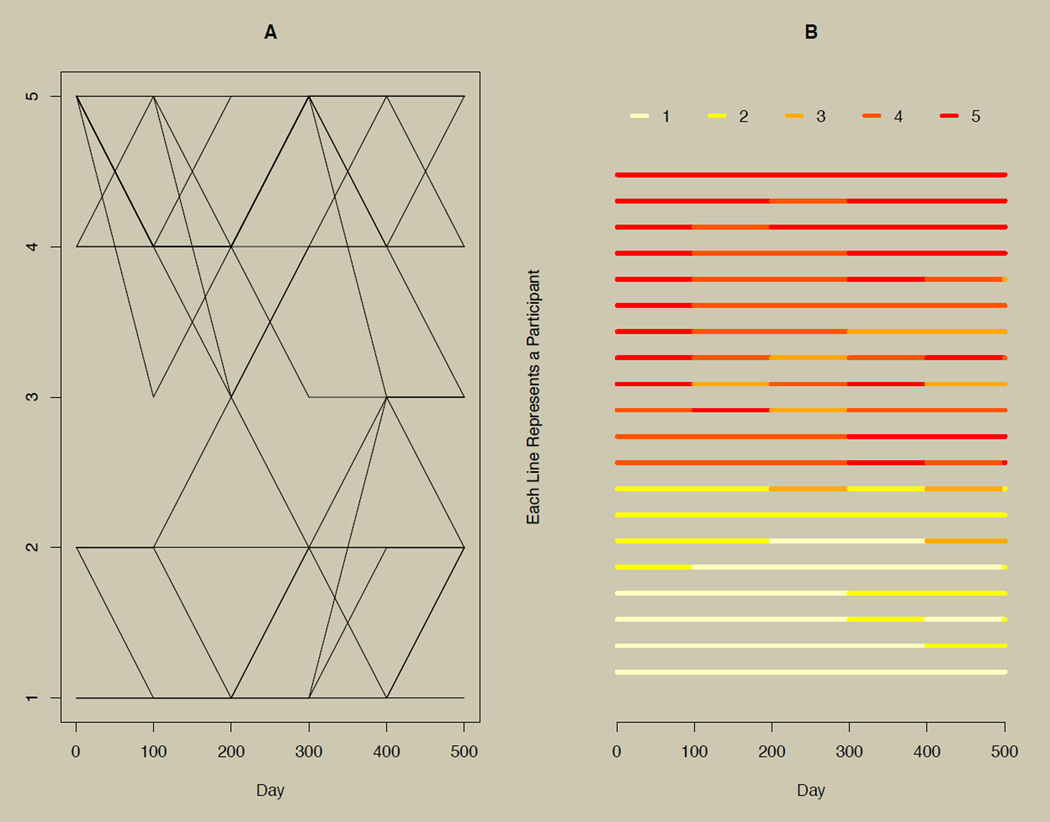
Figure 4. A growth curve plot with the complementary horizontal line plot.
Panel A: A growth plot of categorical longitudinal data with six time points. Panel B: Horizontal line plots of the data presented in Panel A, where shade (or color) rather than vertical position is used to distinguish changes in responses.

