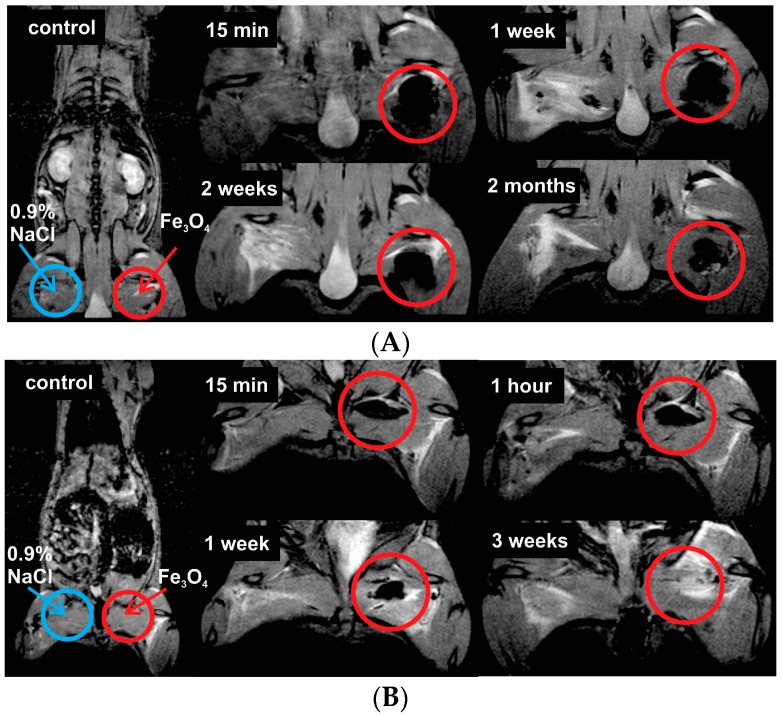
Figure 5.
T2W MR coronal slice images of injection site at different time moments after intramuscular injection at dose of (A) 520 µg Fe3O4/kg (in the upper figure) and (B) 20.8 µg Fe3O4/kg (in the lower figure) in the rat left hind paw (red circles). The arrows marks injection site of physiological saline and Fe3O4 nanoparticles solution.

