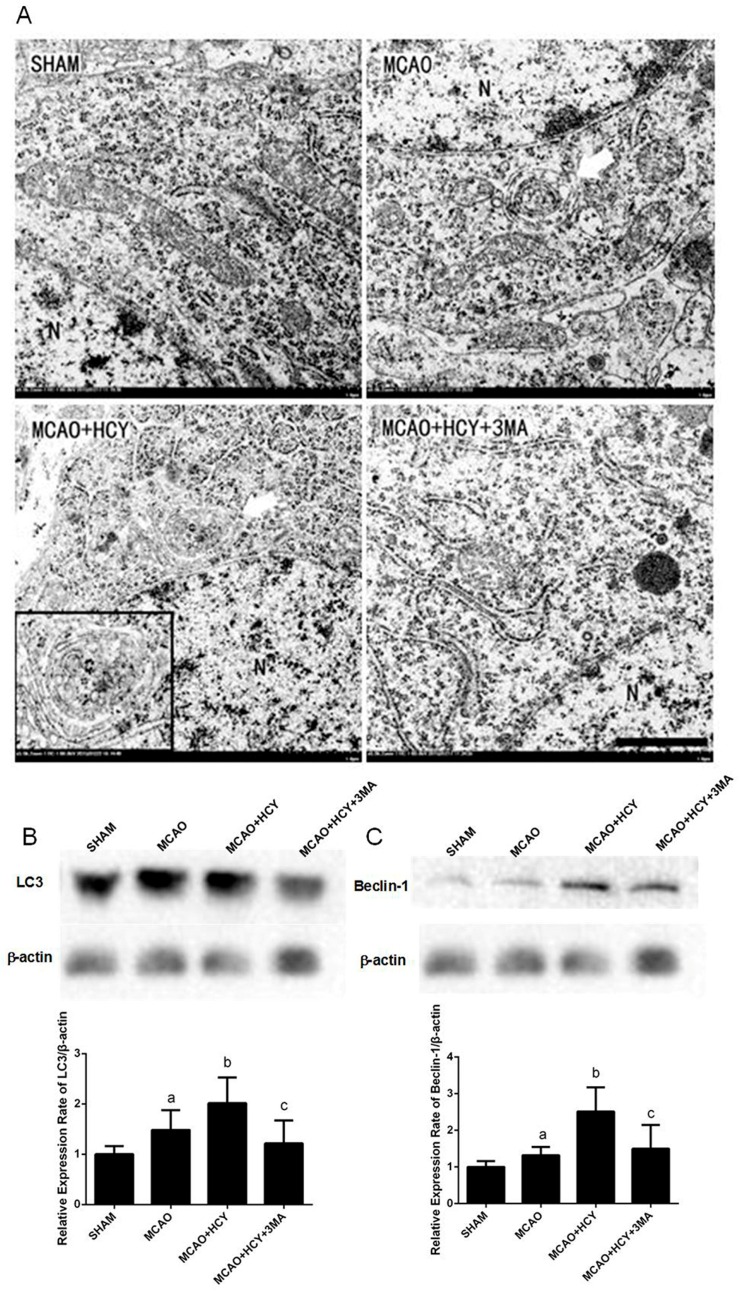
Figure 2.
The effect of Hcy on neuronal ultrastructure and autophagic-related protein expression in the cortex after rat focal cerebral ischemia-reperfusion. (A) The TEM analysis of ultrastructural changes in cortical neurons 24 h after the reperfusion (n = 3 for each group). Arrows indicate autophagosomes. N represents the nucleus. Scale bars = 1 μm; (B,C) Representative western blots for LC3B and Beclin-1 and bar graphs show semiquantitative levels of LC3B/β-actin and Beclin-1/β-actin by band density analysis. The data are presented as the ± s. a p < 0.05 vs. SHAM group, b p < 0.05 vs. MCAO group, c p < 0.05 vs. MCAO + HCY group. n = 4 for each group.

