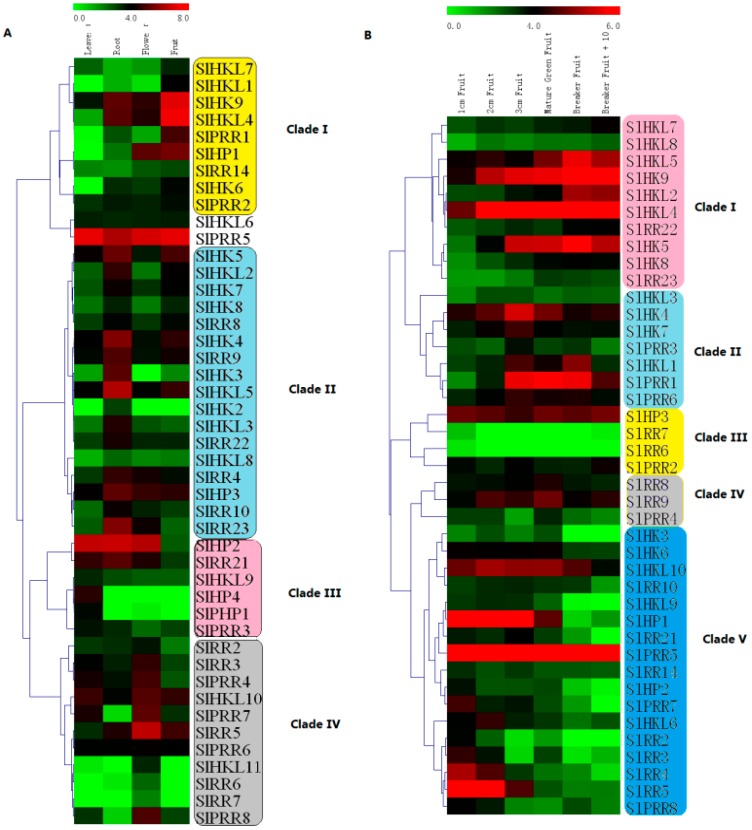
Figure 9.
Heat map representation for organ-specific expression (A) and six fruit development stages-related expression (B) profiles of TCS genes in tomato. These electronic expression data were downloaded from the tomato eFP browser at bar.utoronto.ca. The heatmap was drawn by MeV4.8. The expression levels are presented using fold-change values transformed to Log2 format compared with control. The Log2 (fold-change values) and the color scale are shown at the top of heat map. Green, black, and red represent low, medium, and strong expression, respectively.

