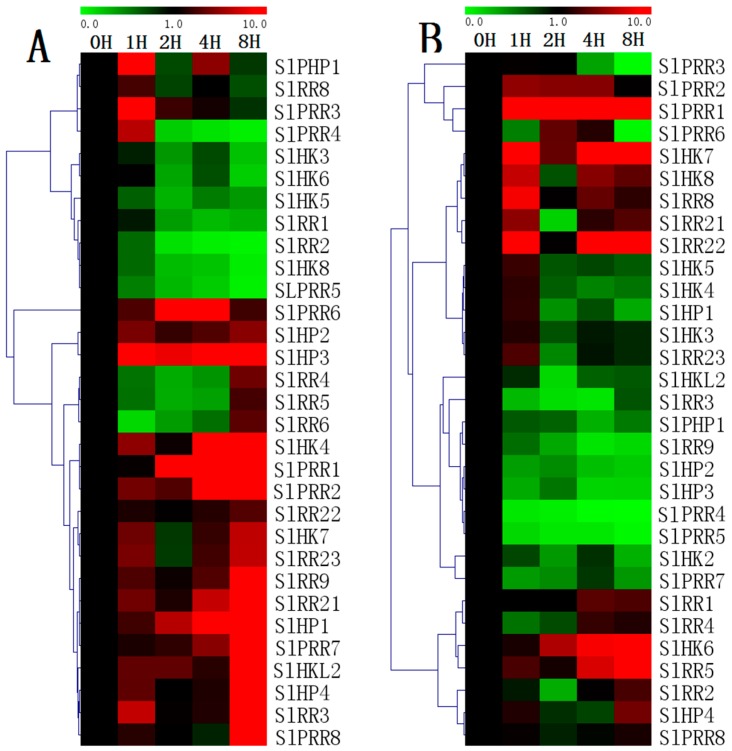
Figure 12.
Heat map representation for the response patterns to drought (A) and salt (B) stresses of TCS genes in tomato. The second true leaves were collected at 0, 1, 2, 4, and 8 h after the onset of stress treatments. For other details, see Figure 10.

