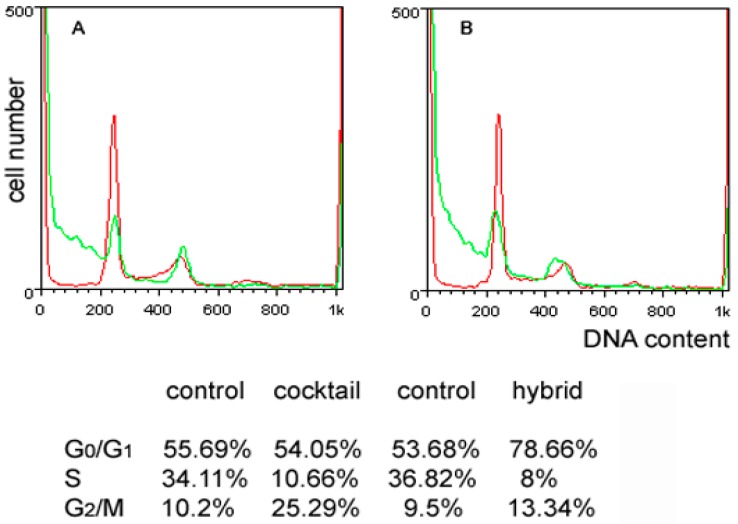
Figure 2.
Effect of the 1/2 cocktail and 3 on the MDA-MB-231 cell cycle. DNA profiles of MDA-MB-231 cells following 72 h of culture under control conditions (red line in A,B) and in the presence of either 10 μM 1/2 cocktail (green line in A) or 29 μM 3 (green line in B). Cell distribution in the different cycle phases is reported in the Table (annex).

