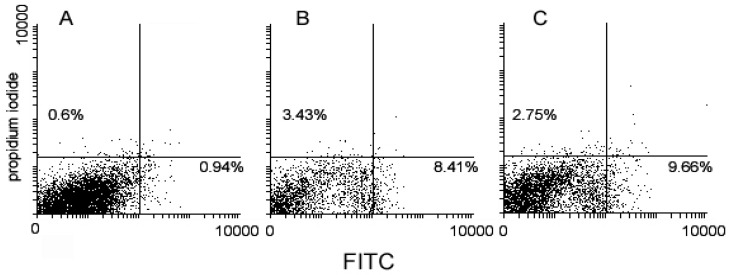
Figure 5.
Flow cytometric analysis of untreated (A), 1/2 cocktail–treated (B) and 3-treated (C) MDA-MB-231 cells stained with two-color reactive oxygen species (ROS) detection reagent after 72 h of exposure for MMP evaluation. The percentage indicated in the bottom right quadrants refers to total ROS overproducing cells, whereas that in the top left quadrants to superoxide anion–overproducing cells.

