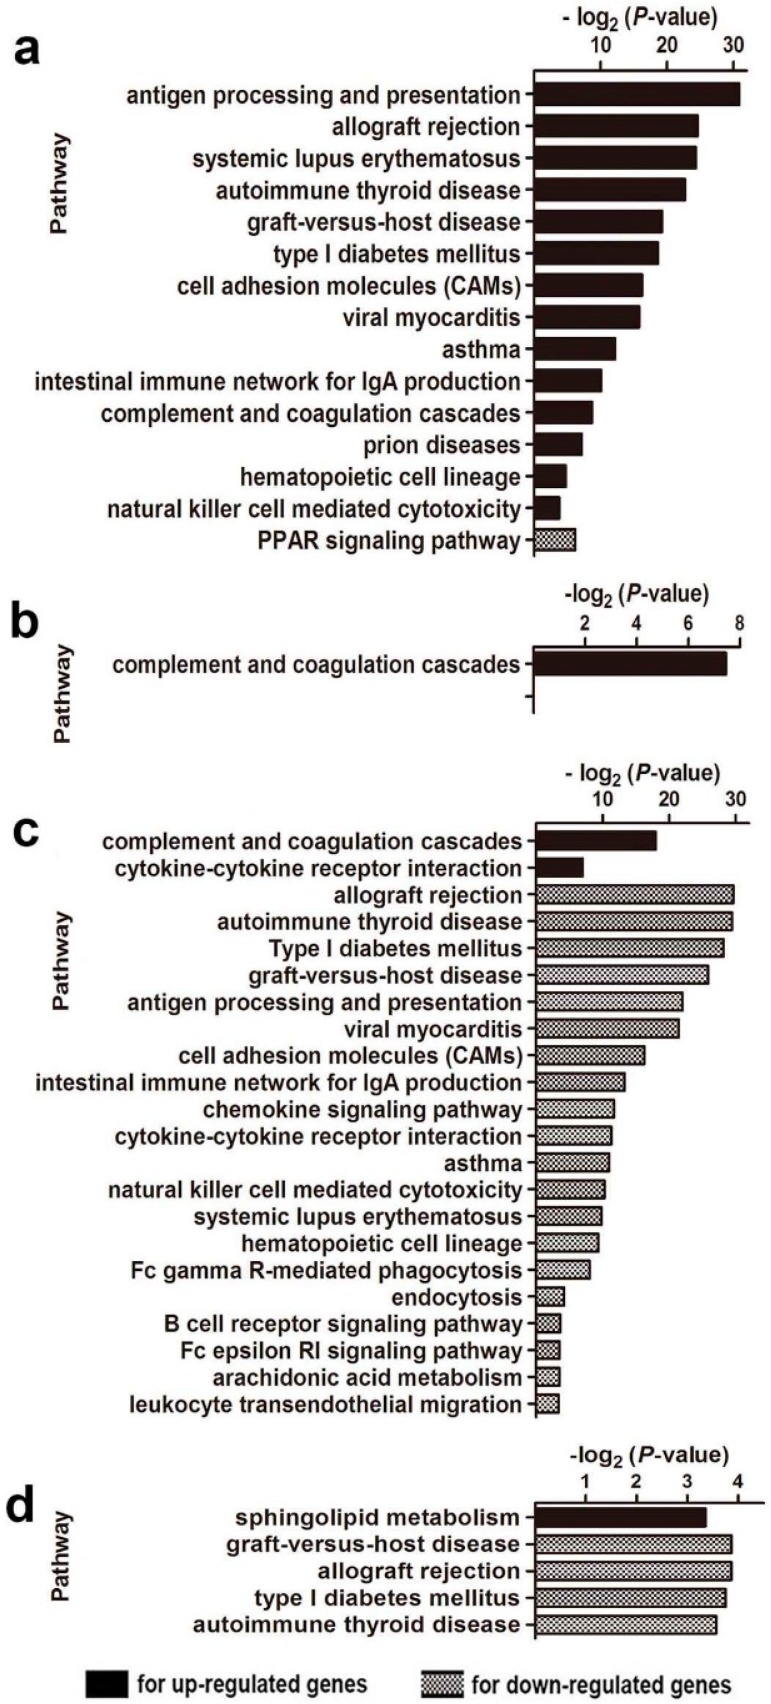
Figure 2.
KEGG pathway analysis of DEGs: (a) based on the DEGs between CpG ODN and control ODN-treated WT mice; (b) based on the DEGs between CpG ODN and control ODN-treated NOD mice; (c) based on the DEGs between CpG ODN-treated WT and NOD mice; and (d) based on the DEGs between Control ODN-treated WT and NOD mice.

