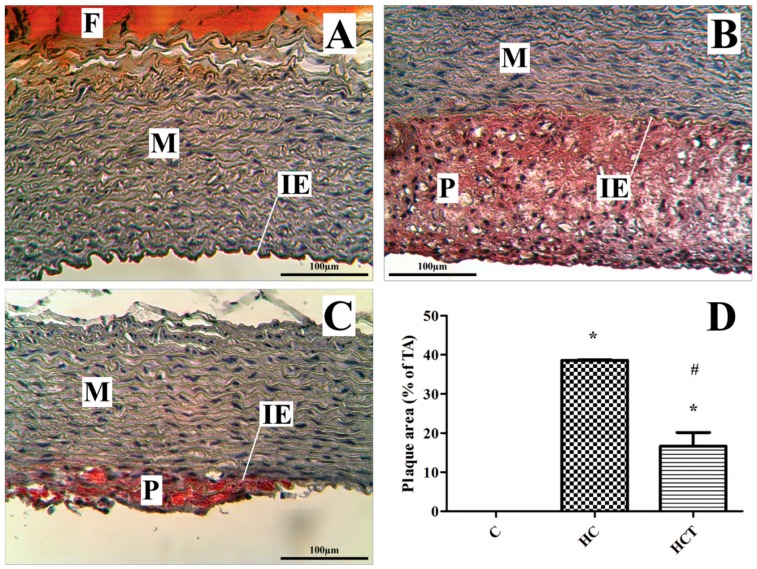
Figure 4.
Aortic histologic analysis. Histological sections of aortas from three groups of rabbits stained with hematoxylin-oil red O (A–C, magnification 25×). Bright red-stained lipid shows atherosclerotic plaques in the HC (B) and HCT groups (C). Internal elastic lamina is shown as IE; M, media; P, atherosclerotic plaques; and F, adventitial fatty tissue stained with oil red O. Comparison of plaque area in the three groups, expressed as a percentage of the total area (D). * p < 0.05 for comparison with the control group outcomes; # p < 0.05 for comparison with the HC group outcomes.

