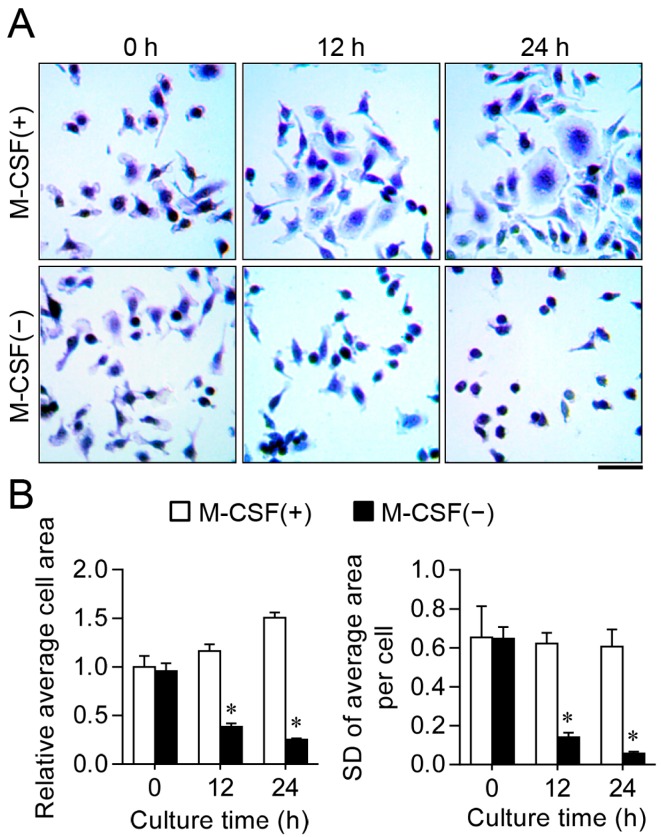
Figure 1.
Effects of macrophage colony-stimulating factor (M-CSF) deprivation on the morphology and size of osteoclast progenitors. (A) Cells were cultured in the absence or presence of M-CSF for the indicated times and then stained with crystal violet. Scale bar: 50 µm; (B) Relative average cell surface area was determined by dividing the total cell area by the number of cells (left panel), and SD of the average area per cell was determined by measuring the area of individual cells (right panel), in photographs similar to those in (A). * Differences compared with control were statistically significant (p < 0.01, ANOVA).

