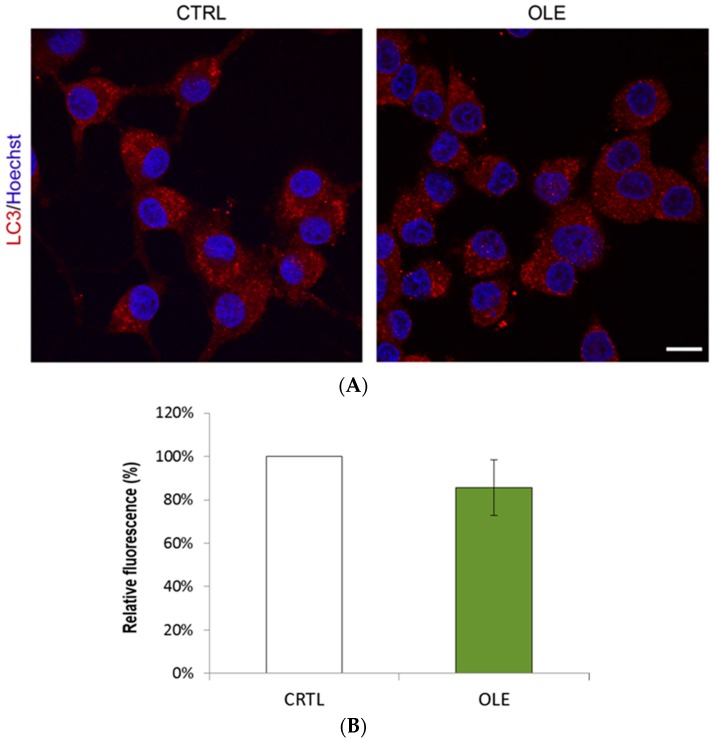
Figure 4.
OLE administered alone does not affect the amount of LC3-II-positive vesicles. (A) Representative microphotographs show similar numbers of fluorescent vesicles between CTRL and neuronal PC12 cells treated for 3 h with 10−12 M OLE alone, as revealed by LC3-II immunofluorescence (red). Nuclei were counterstained with Hoescht 33342. Scale bar = 10 μm; (B) Histogram represents semi-quantitative measures of LC3-II red fluorescence. OLE and CTRL show no significant differences.

