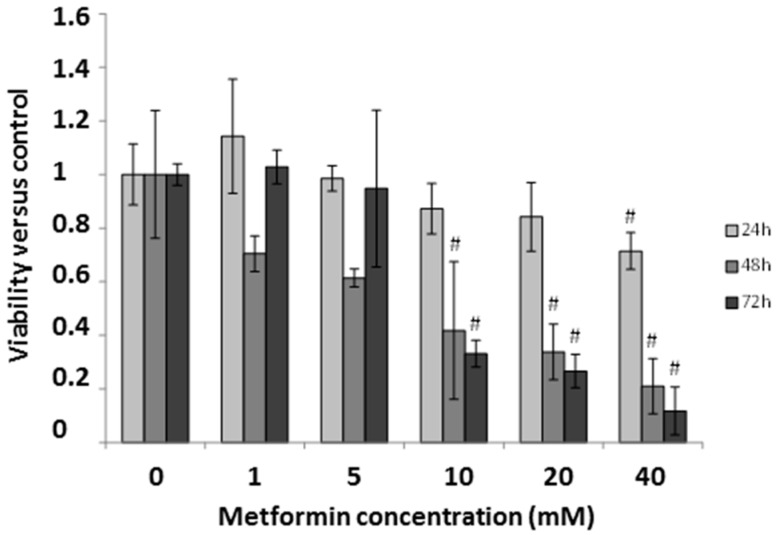
Figure 6.
The effect of metformin on MDA-MB-231 cell line viability at different time-points and concentrations. Error bars represent the standard deviation of triplicate experiments. Statistically significant differences are shown for the comparison between treated cells and the control (not treated) at respective time-points (Student t test: # p < 0.001).

