Figure 9.
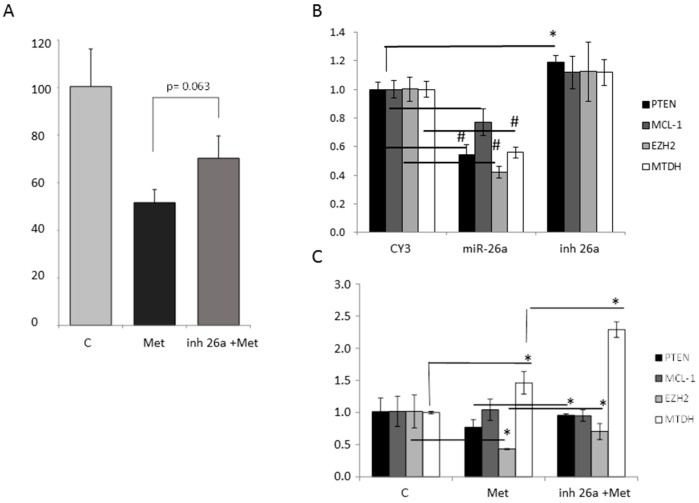
The effect of metformin through miR-26a on MDA-MB-231 cells. (A) Cell viability at 48 h after 10 mM metformin treatment with or without the miR-26a inhibitor (50 nM); (B) Gene expression of miR-26a targets after transfection with either 50 nM miR-26a mimetic or its inhibitor, as measured by RT-qPCR. CY3: CY3 control miRNA; (C) Expression of miR-26a targets measured by RT-qPCR after treatment with 10 mM metformin (in presence or not of miR-26a inhibitor) or vehicle (PBS). Error bars represent triplicate experiments. (Student t test: * p < 0.05; # p < 0.001).

