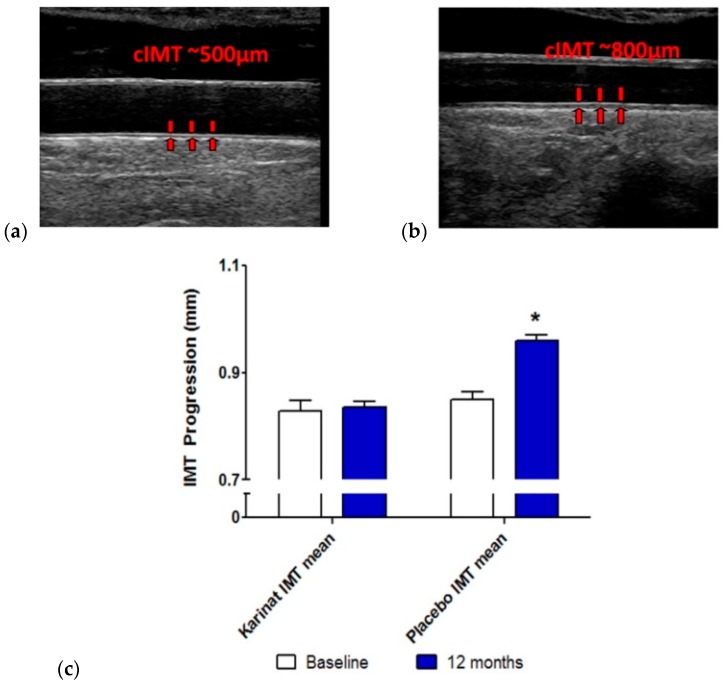
Figure 1.
Actual individual ultrasound images and cIMT values at the baseline and after 12-month follow-up. (a) Normal cIMT in apparently healthy postmenopausal women; (b) Abnormally increased cIMT in apparently healthy postmenopausal women; (c) Dynamics of cIMT in isoflavonoid-rich herbal preparation and placebo recipients at the baseline (open bars) and after 12-months follow-up (filled bars). The data are presented as mean and S.E.M. *, represents a significant difference between baseline and follow-up cIMT values; p < 0.05.

