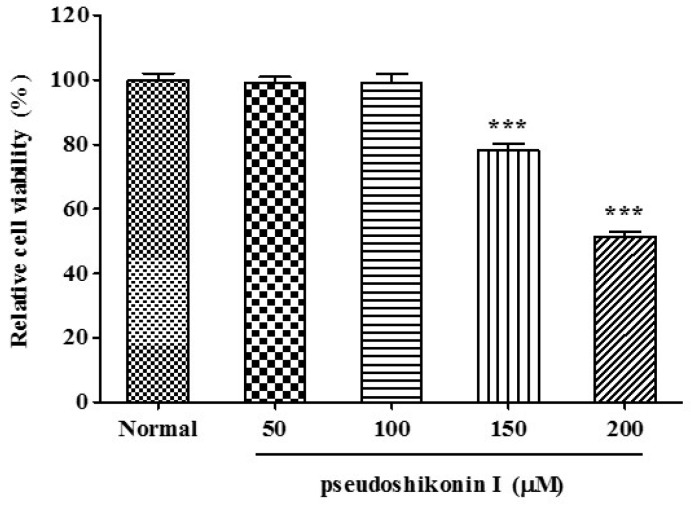
Figure 2.
Cell viability of pseudoshikonin I in SW1353 cells. SW1353 cells were treated with indicated concentrations of pseudoshikonin I for 24 h. Normal represents samples only supplied with DMEM and cell viability assay being conducted by the MTT method. Results are expressed as the percentage change of control condition in which cells were grown in medium without pseudoshikonin I. Results shown are mean S.D. of experiments in triplicate. * p < 0.05; ** p < 0.01; *** p < 0.001 compared with control.

