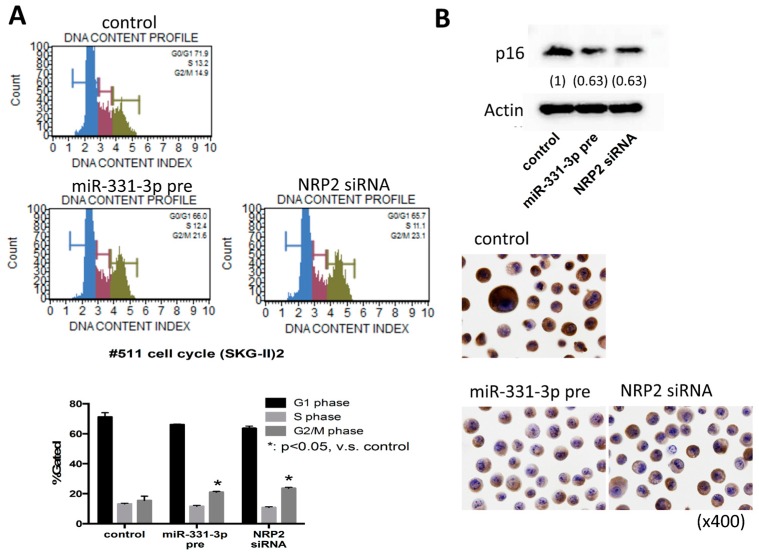
Figure 8.
Cell cycle analysis in the SKG-II cells. Cell cycle analysis using the Muse™ Cell Analyzer (Millipore; Hayward, CA, USA). (A) The upper panels show the DNA content profile by transient transfection of with the miR-331-3p precursor (miR-331-3p pre) or NRP2 siRNA. The DNA histogram results show the distribution of the cell cycle phases; G0/G1 (blue), S (red) and G2/M (green). The lower panel shows the percentage of G1, S, or G2/M phase; (B) Western blotting (upper panel) and immunocytochemistory (lower panel) for p16INK4a (p16) protein expression in SKG-II cells.

