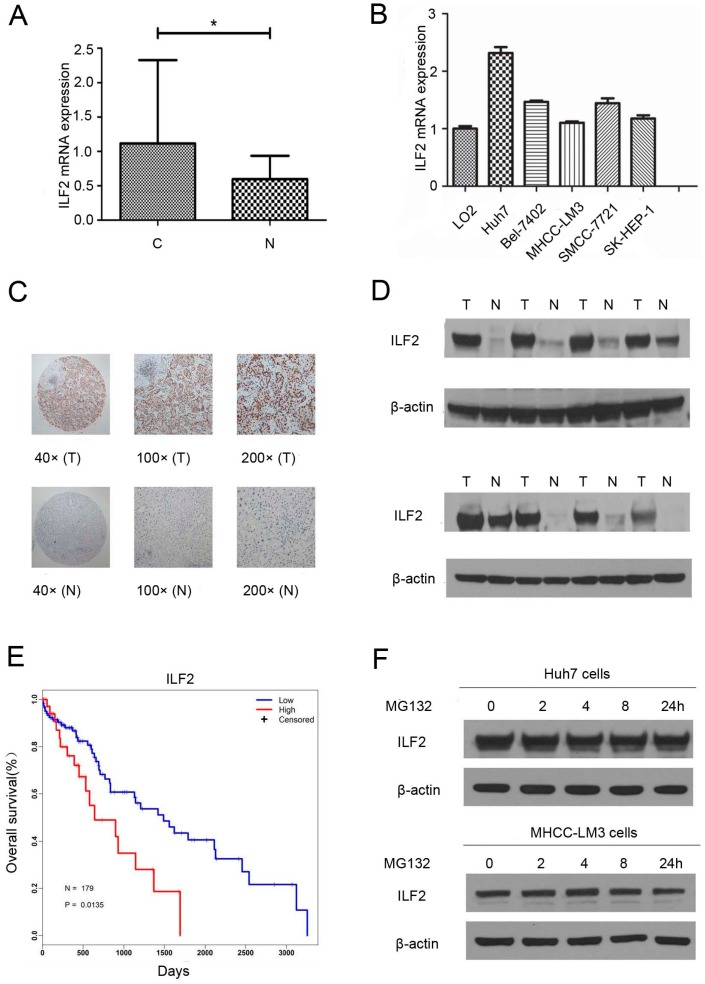
Figure 1.
Expression patterns of interleukin enhancer binding factor 2 (ILF2) in hepatocellular carcinoma (HCC) tissues and cell lines. (A,B) mRNA levels of ILF2 were analyzed using quantitative real-time PCR (qRT-PCR) in HCC tissues and HCC cell lines; bars, standard deviation (SD) * p < 0.05; (C) Immunohistochemical image of ILF2 expression in liver tumor tissues (T) and normal tissues (N). Representative image of ILF2 at 40×, 100×, and 200× magnification; (D) ILF2 protein expression in HCC (T) and normal (N) tissues; (E) Kaplan–Meier survival curves of overall survival of HCC patients with high and low ILF2 expression; p = 0.0135; Regression coefficient (Coef) = 0.7187; Hazard ratio exp(coef) = 2.0518; 95% lower confidence limits (lower 0.95) = 1.1453; 95% upper confidence limits (upper 0.95) = 3.6757; (F) Huh7 and MHCC-LM3 cells following treatment with 10 μM MG132 at indicated time points. ILF2 and β-actin levels were measured by Western blot.

