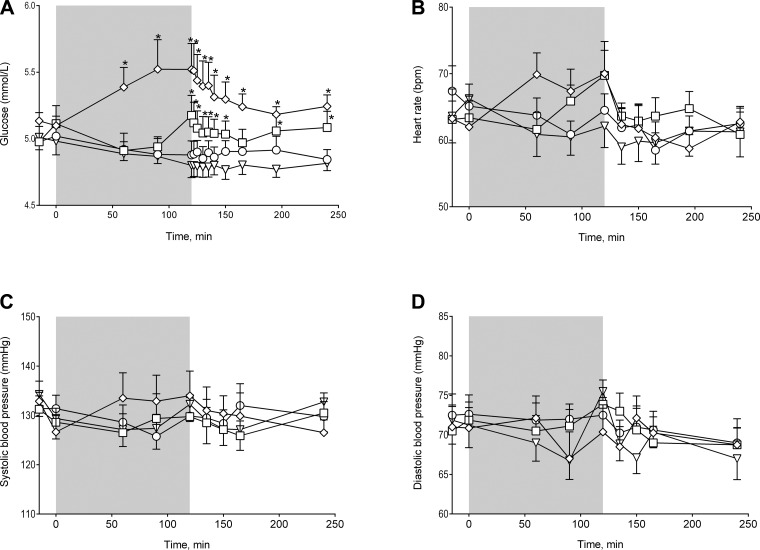
Fig. 5.
A: plasma glucose time course (treatment × time effect, *P < 0.0001). B: heart rate (no treatment × time effect, P = 0.091). C and D: systolic and diastolic blood pressure (no treatment × time effect, P = 0.57 and P = 0.47, respectively). Placebo (▽), PYY1–36 + sitagliptin (○), PYY1–36 (□), and PYY3–36 (◇) are shown. Data are means ± SE. Comparisons were made using a 2-way repeated-measures ANOVA. If significant, PYY infusions were compared with placebo by post hoc testing with Bonferroni corrections for multiple comparisons.

