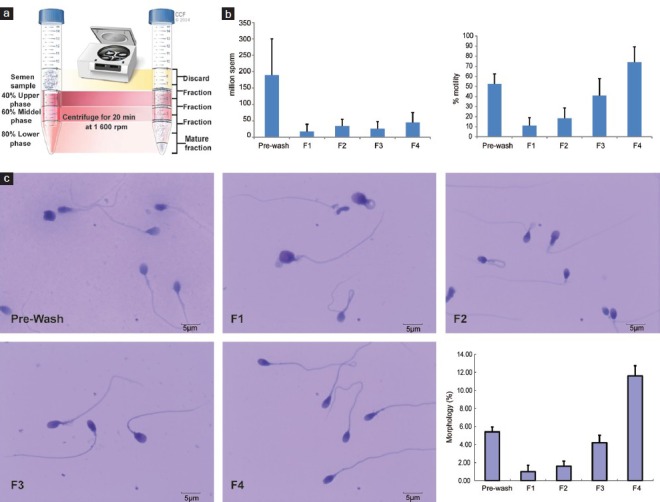
Figure 1.

Separation of immature and mature spermatozoa (a) after a three-layer density gradient. (b) Sperm count, percentage of motility. Error bars represent standard deviations values for each parameter. (c) Sperm morphology before (Prewash) and after density gradient in each fraction. Error bars represent standard deviations values for each parameter. For 1c: Sperm morphology in various fractions is shown as: Prewash; Fraction 1 (F1); Fraction 2 (F2); Fraction 3 (F3); Fraction 4 (F4); and percentage of normal sperm morphology in each fractions. Error bars were shown as s.d. values of each parameter.
