Figure 3.

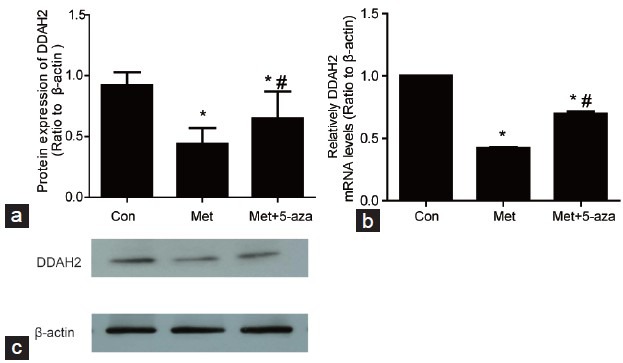
The protein and mRNA levels of DDAH-2 in cavernosum tissues. (a) DDAH-2 protein decreased in Met group compared with Con and increased in Met+5-aza group compared with Met group. (b) The DDAH-2 mRNA decreased in Met group compared with Con group while increased in Met+5-aza group in comparison with Met group. (c) Western blot results of DDAH-2 protein and β-actin. *P < 0.05 versus Con group; #P < 0.05 versus Met group; Con: control group; Met: methionine group; Met+5-aza: 5-aza treated group.
