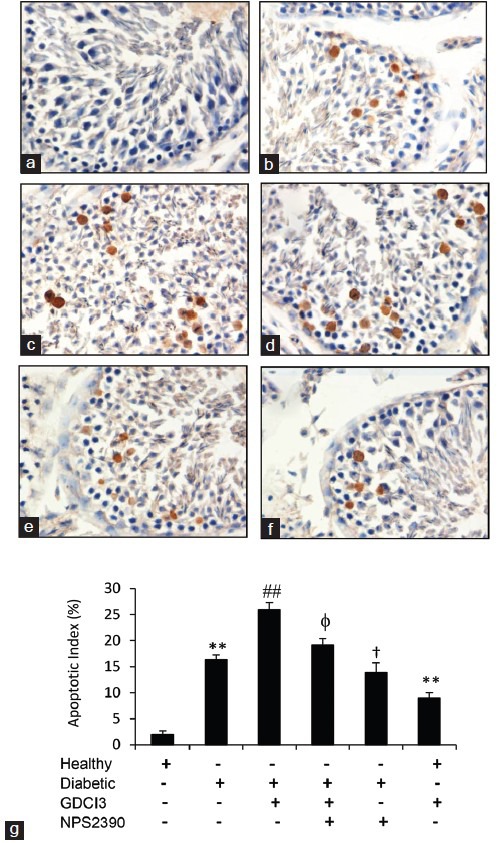
Figure 3.

Apoptosis of germ cells in testicular tissues. (a–f) Representative testicular sections stained by TUNEL (×400 magnifications). Healthy (a) and diabetic (b) rats were injected with vehicle while diabetic rats were injected with GdCl3 (c), GdCl3 + NPS-2390 (d) or NPS-2390 (e) for 1 week, healthy rats were injected with GdCl3 (f) for 1 week, and then all animals were killed to collect testicular tissues. (g) TUNEL-positive germ cells were counted to record the apoptosis index. Results are expressed as the mean ± s.e.m. (n = 6). “*” (P < 0.05) and “**” (P < 0.001) versus untreated healthy rats; “φ” (P < 0.05) and “φφ” (P < 0.001) versus GdCl3-treated diabetic rats. “#” (P < 0.05) and “##” (P < 0.001) indicate a significant increase, and “†” (P < 0.05) indicates a significant reduction from untreated diabetic rats.
