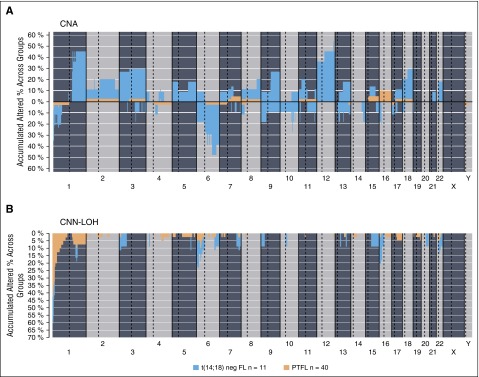
Figure 5.
Comparative plot of copy number (CN) and CNN-LOH aberrations between PTFL and conventional t(14;18)− FL analyzed by CN array. (A) Copy number and (B) CNN-LOH. X-axis depicts chromosome positions with dotted lines pointing centromeres. Y-axis indicates frequency of the genomic aberration among the analyzed cases. PTFL are depicted in yellow whereas conventional t(14;18)− FL are depicted in dark blue.

