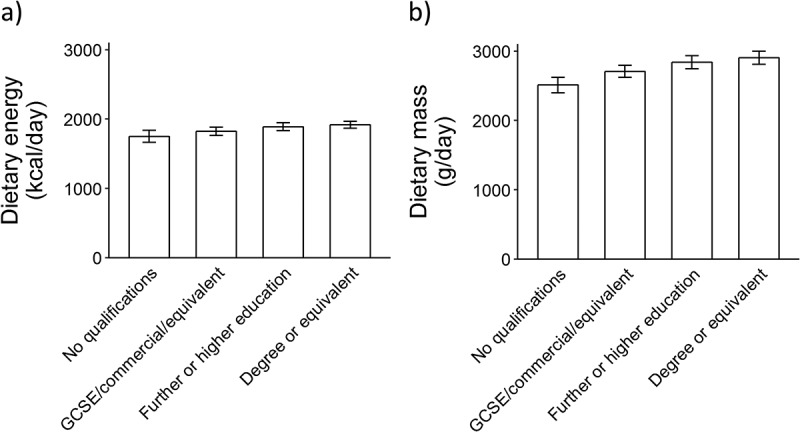
Figure 1.

Bar chart indicating the age- and sex-adjusted (a) mean dietary energy intake and (b) mean dietary mass intake and 95% confidence interval by educational attainment using survey representative UK data for UK adults from the National Diet and Nutrition Survey (2008–2012) (n = 2083). 16
