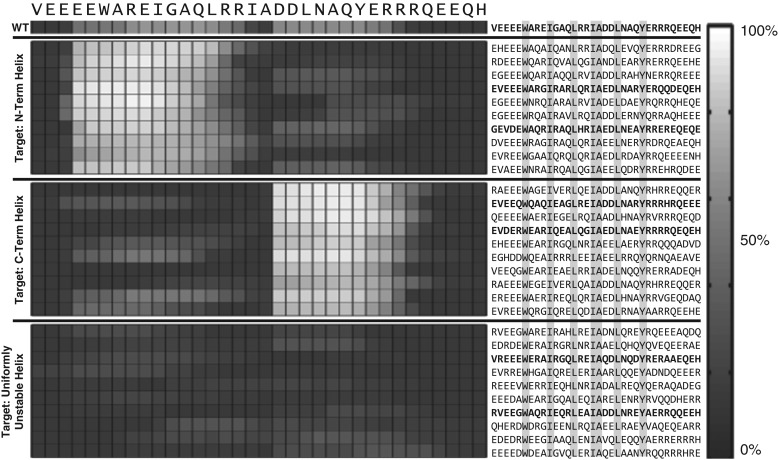
Fig. 7.
Sequence variants of PUMA that were generated using GADIS for the NTH, CTH and UUH target profiles. The checkerboard plots quantify the residue-specific helical propensities. These are quantified in terms of the percent probability that a specific residue is part of a regular helical segment that is at least six residues long. On the left, the first ten rows pertain to sequence variants that correspond to the NTH profile, the middle ten rows correspond to the CTH profile, and the last ten rows correspond to the UUH profile. The sequences corresponding to each row of residue-specific helical propensities are shown on the right. The positions of the immutable residues are highlighted to emphasize the constraints. Additionally, sequences shown in bold face were used in UV-CD measurements. The wild type PUMA sequence is also shown as reference.

