Figure 1.
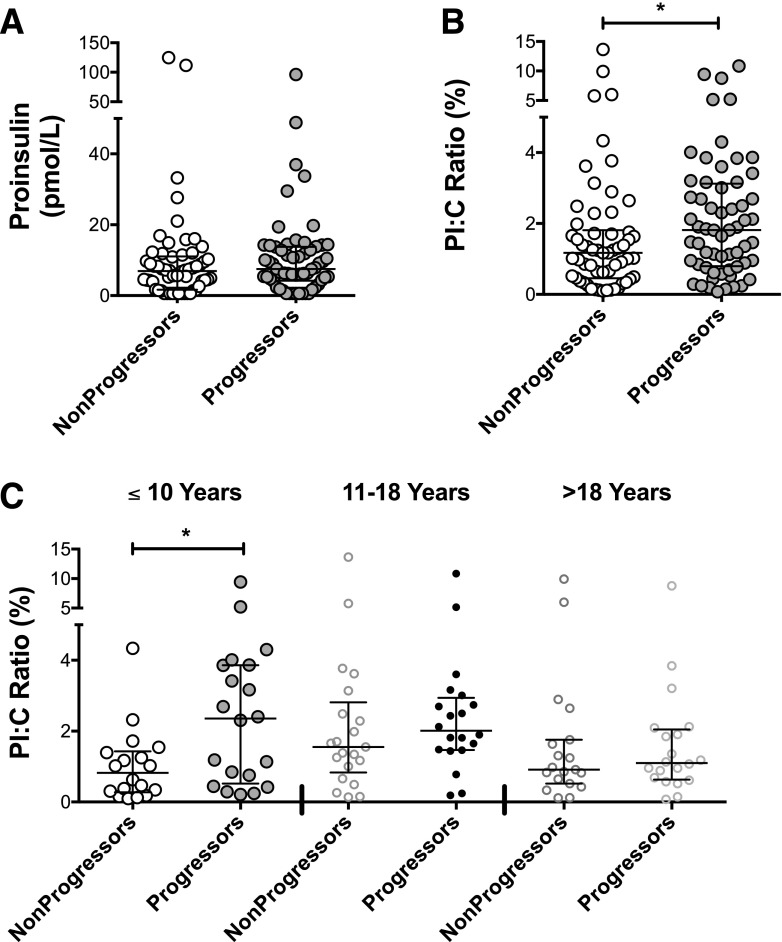
PI:C ratios in nonprogressors and progressors. A: Scatterplot of absolute PI values for all nonprogressor and progressor subjects. A Wilcoxon rank sum test revealed no significant differences between groups. B: Scatterplot of PI:C ratios for all nonprogressors and progressor subjects. Wilcoxon rank sum test demonstrated higher PI:C values in progressors (P = 0.03). For both PI and PI:C ratios, n = 58 for nonprogressors and n = 60 for progressors. C: PI:C ratios by age categories, as follows: ≤10 years old (n = 38), 11–18 years of age (n = 41), and >18 years of age (n = 39). Kruskal-Wallis test demonstrated significant differences between groups (P = 0.02). Dunn multiple-comparisons test revealed that only differences between nonprogressors and progressors in the group of subjects ≤10 years of age reached statistical significance (P < 0.05). *P ≤ 0.05.

