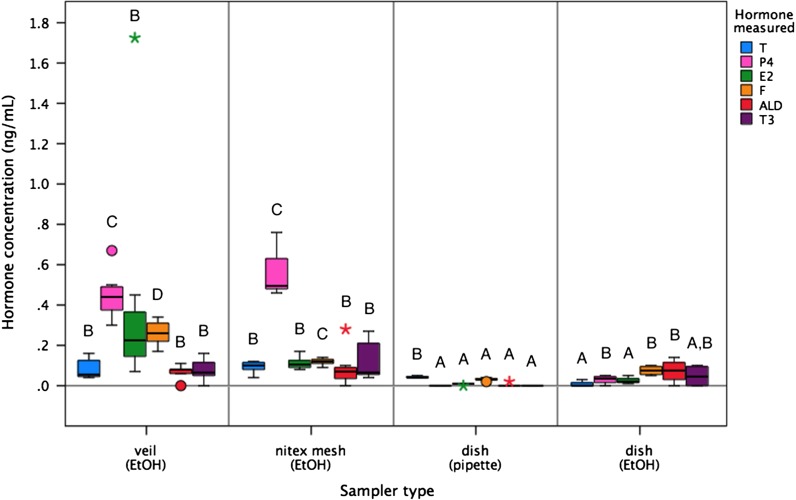
Figure 1:
Quantification of assay interference from different sampling materials (veil, nitex mesh or dish) after extraction [using ethanol (EtOH) rinse or direct pipetting; n = 8 replicates for each sampler type], as determined for six immunoassays [testosterone (T), progesterone (P4), estradiol (E2), cortisol (F), aldosterone (ALD) and triiodothyronine (T3)]. For boxplots, the line inside the box indicates the median value, the height of the box encompasses the distance between the 25th and 75th quartiles, and the whiskers delineate extreme observations. Outliers are marked with a circle (>1.5 × interquartile range) and extreme outliers are marked with a star (>3 × interquartile range). Different letters denote a significant difference in resulting hormone measures between sampler types at P < 0.05.

