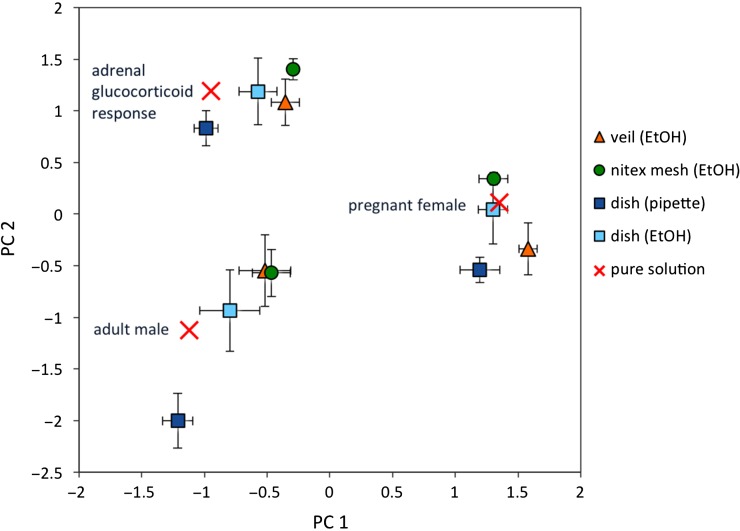
Figure 3:
Component matrix of the principal component analysis, showing the factor scores for each treatment solution (adult male, pregnant female and adrenal glucocorticoid profile) after processing on each sampler type [veil (EtOH), nitex mesh (EtOH), dish (pipette) or dish (EtOH)]. Expected levels in pure mixed hormone solutions before processing are marked with a cross. Values are means ± SD.

