
Figure 3.
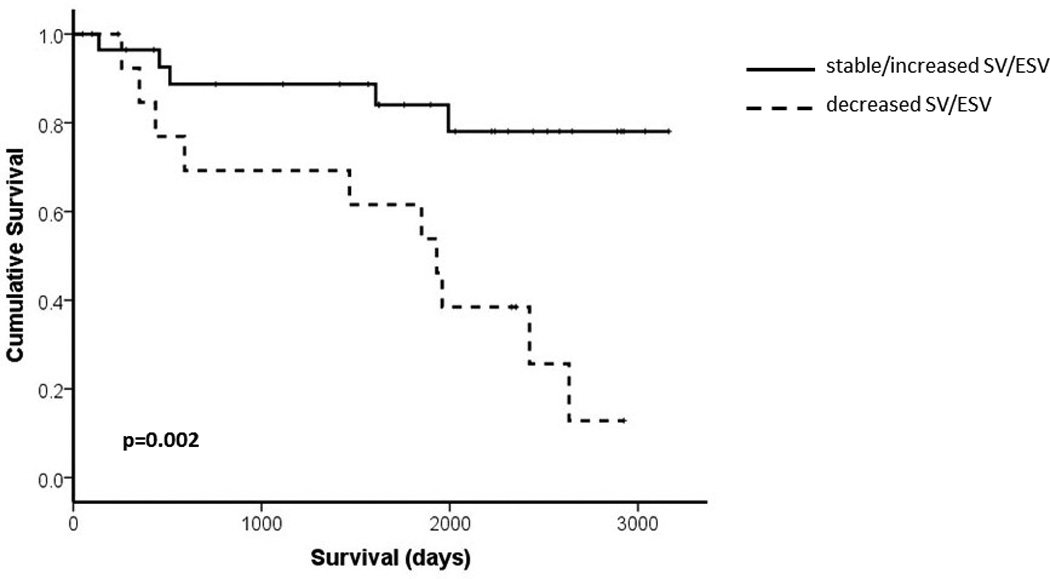
Kaplan Meier curve describing survival of PAH patients with decrease in SV/ESV (n= 13) or stable/increased SV/ESV (n=31) at follow up.
Official websites use .gov
A
.gov website belongs to an official
government organization in the United States.
Secure .gov websites use HTTPS
A lock (
) or https:// means you've safely
connected to the .gov website. Share sensitive
information only on official, secure websites.
Kaplan Meier curve describing survival of PAH patients with decrease in SV/ESV (n= 13) or stable/increased SV/ESV (n=31) at follow up.