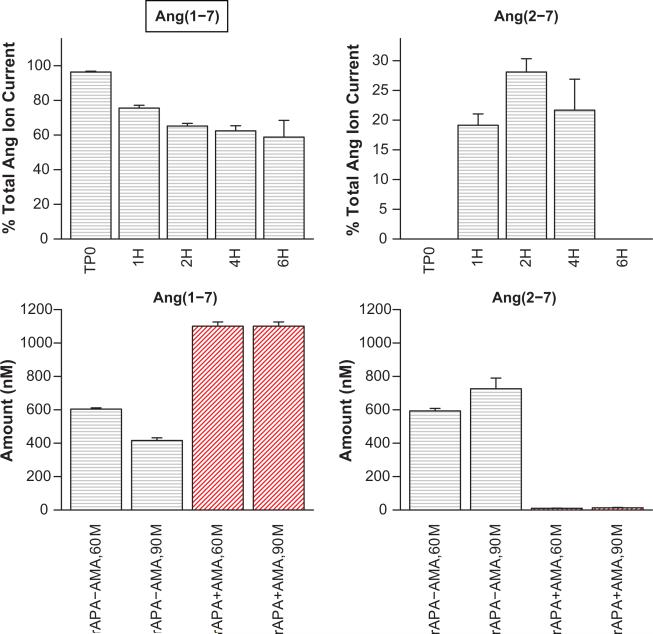
Figure 6.
Compilation of normalized data for Ang peptides vs. time, organized by experimental condition shown with predicted time course uncertainty for the proposed network model. Experimental conditions across top indicate the added peptide and the inhibitors (e.g. ACEi indicates ACE inhibition.) Times are given in minutes and amounts in μmol/L, normalized to a 1 μmol/L substrate addition. Time course uncertainty bounds are taken from the 95% credible interval on trajectories computed from 5,000 kinetic and flyability parameter samples from the MCMC process (1,000 from each of 5 independent chains following burn-in and thinning). The dashed line gives the time course median. Red dots indicate data from the original spectrum archive, green dots from experiments performed as part of this study. Ang(2-10) data is shown in 2 columns, each containing data from separate groups of experiments.

