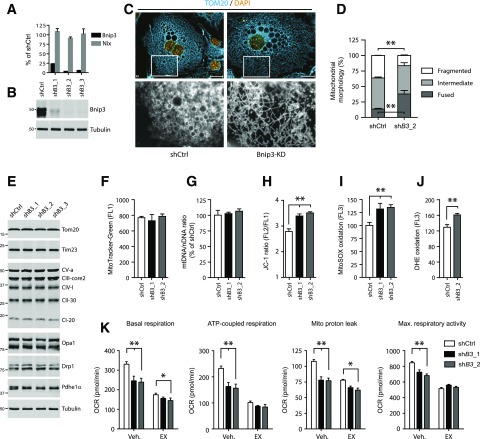
Figure 4.
Adipose Bnip3 modulates mitochondrial fusion-fission balance and bioenergetics. A: Relative Bnip3 and Nix mRNA levels (expressed as a percentage of shCtrl). B: Immunoblot analysis of Bnip3 protein in 3T3-L1 adipocytes stably transduced with shCtrl or shRNAs targeting Bnip3 (shB3_1–3) and differentiated for 7 days. C and D: Representative image of (C) (bottom row, magnification ×10) and quantified mitochondrial morphology (D) in shCtrl or shB3_2 adipocytes and immunostained for endogenous Tom20 protein. Morphology was scored as follows: fragmented, punctuate and round; intermediate, mixture of round and shorter tubulated; elongated, long and high interconnectivity. Values are expressed as a percentage of the total number of cells counted (≥100 per experiment). E: Immunoblot analysis of multiple markers for mitochondrial function and metabolism. F: Flow cytometric analysis of MitoTracker Green staining. G: The mitochondrial-to-nuclear DNA ratio. Flow cytometric analysis of the ∆ψm using JC-1 (H) and mROS formation using MitoSOX (I) and DHE (J). K: Mitochondrial bioenergetics profile. Basal OCR, ATP-linked and proton leak–associated respiration (oligomycin; 2 µmol/L) and maximal respiratory capacity (FCCP; 0.75 µmol/L) were examined using a Seahorse XF96 extracellular flux analyzer. Where indicated, the CPT1-inhibitor EX (100 µmol/L) or H2O vehicle (Veh.) was injected during the assay. Max., maximum. Values are expressed as mean ± SEM (n = 3 in A, C, and D; n = 4 in F–J; and n = 7 or 8 in K). Scale bars, 20 μm. *P < 0.05; **P < 0.01.

