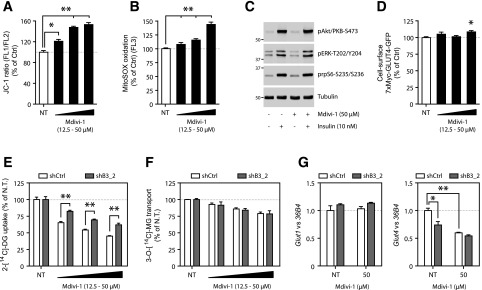
Figure 6.
Pharmacological Drp1 inhibition phenocopies the effects of Bnip3 KD in 3T3-L1 adipocytes. Flow cytometric analysis of ∆ψm with JC-1 (A) and mROS formation with MitoSOX (B) in the presence or absence of the mitochondrial fission inhibitor Mdivi-1 (12.5–50 µmol/L) for 5 h. Ctrl, control; NT, not treated. C: Phospho-Akt (pAkt)/PKB, phospho-ERK1/2 (pERK), and phospho-rpS6 (prpS6) levels of 3T3-L1 adipocytes treated with and without Mdivi-1 (50 µmol/L) for 5 h and during the final 15 min with insulin (10 nmol/L). D: Flow cytometric analysis of 7XMyc-GLUT4 plasma membrane occupancy (FL2) in 3T3-L1 adipocytes stably transduced with 7XMyc-GLUT4-GFP, starved (5 h) in the presence or absence of Mdivi-1 (12.5–50 µmol/L), and stimulated with insulin (10 nmol/L) for 15 min. Insulin-stimulated (10 nmol/L) 2-DG uptake (E) and 3-MG transport (F) in the presence of Mdivi-1 (12.5–50 µmol/L) for 5 h. The NT values are expressed as 100% for both shCtrl and shB3_2 to address the relative sensitivity to Mdivi-1. G: Relative Glut1 and Glut4 mRNA levels in 3T3-L1 adipocytes treated with and without Mdivi-1 (50 µmol/L) for 24 h. Values are expressed as mean ± SEM (n = 3 or 4 in A, B, and E–G; n = 6 in D). *P < 0.05; **P < 0.01.

