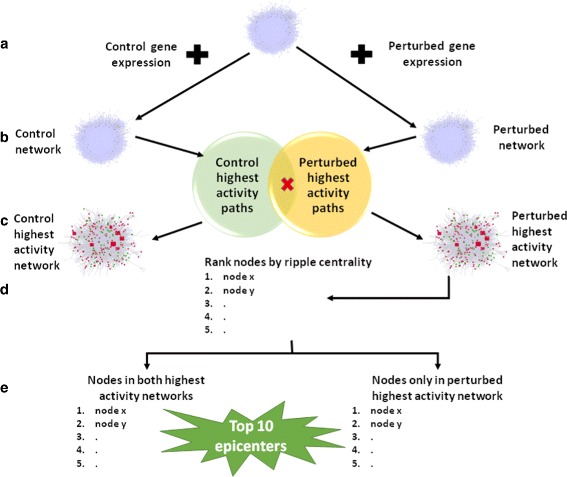
Fig. 1.

The EpiTracer workflow. a Gene expression profiles of each condition are mapped onto the base PPI network. b Highest activity paths are calculated for each condition, and common paths are discarded, giving condition-specific highest activity paths (CSHAPs). c The network induced by the CSHAPs form the condition-specific highest activity networks (CSHANs). d Nodes in the perturbed highest activity network are ranked according to ripple centrality. e The ranked list of nodes is split into two lists based on overlaps with the control highest activity network. Top 10 nodes in the list unique to the perturbed condition form the epicenters specific to the perturbation
