
Fig. 2.
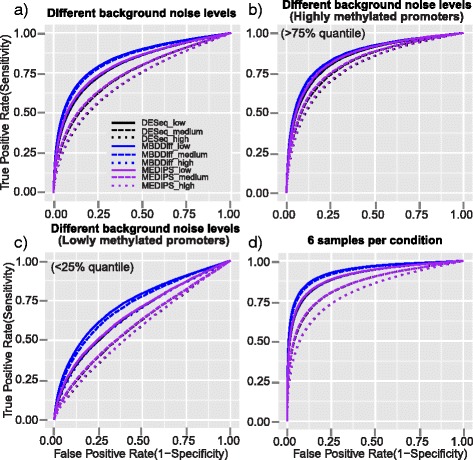
ROC curves of MBDDiff, MEDIPS and DESeq for simulated datasets in different scenarios. ROC curves for simulated MBDcap-seq datasets with low, intermediate or high level of background noise with 3 number of replicates in each group, 10 % of DM promoters with 2 fold of difference (a); Different levels of background noise but only for highly methylated promoters above 75 % quantile of methylation levels (b); Different levels of background noise but only for lowly methylated promoters below 25 % quantile of methylation levels (c); ROC curves for simulated MBDcap-seq datasets with low, intermediate or high level of background noise with 6 number of replicates in each group, 10 % of DM promoters with 2 fold of difference (d); Simulation was carried out 100 times and the average results is used