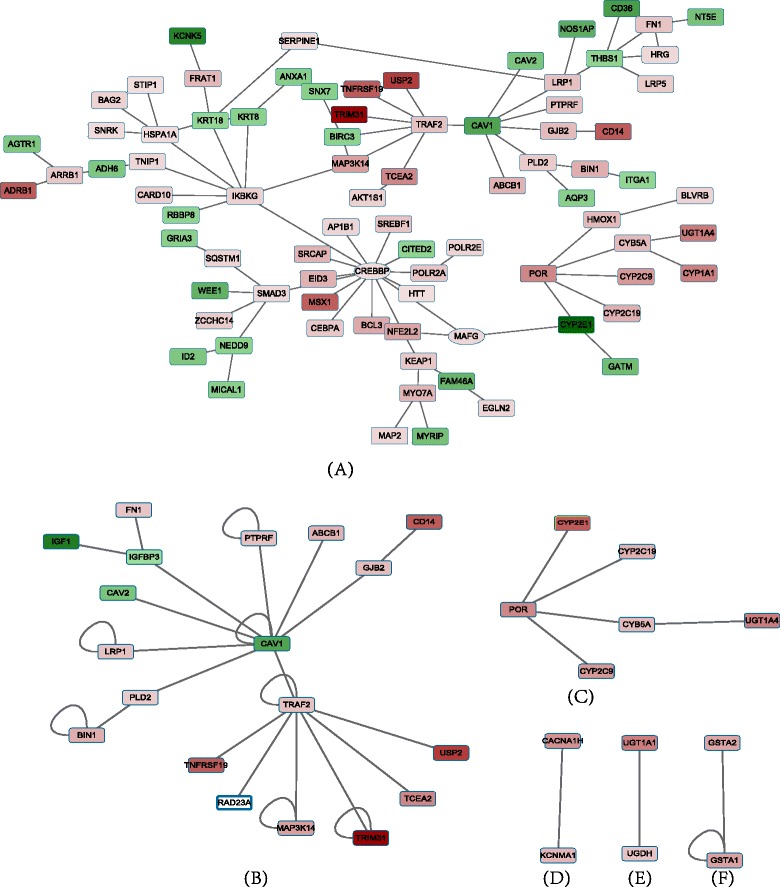
Fig. 3.

The functional modules of RrPIN. a The maximally functional module of PPI network. Color is according to the fold change where red denotes upregulated and green denotes downregulated. The shape of the nodes depicts the aggregate score: circles indicate a negative score, rectangles denotes a positive score. b, c, d, e and f are the five functional modules of RrPIN. The regulatory relationships are denoted by colours in which red indicates upregulated genes, and green indicates downregulated. As well, the depth of the colour explains the size of fold change
