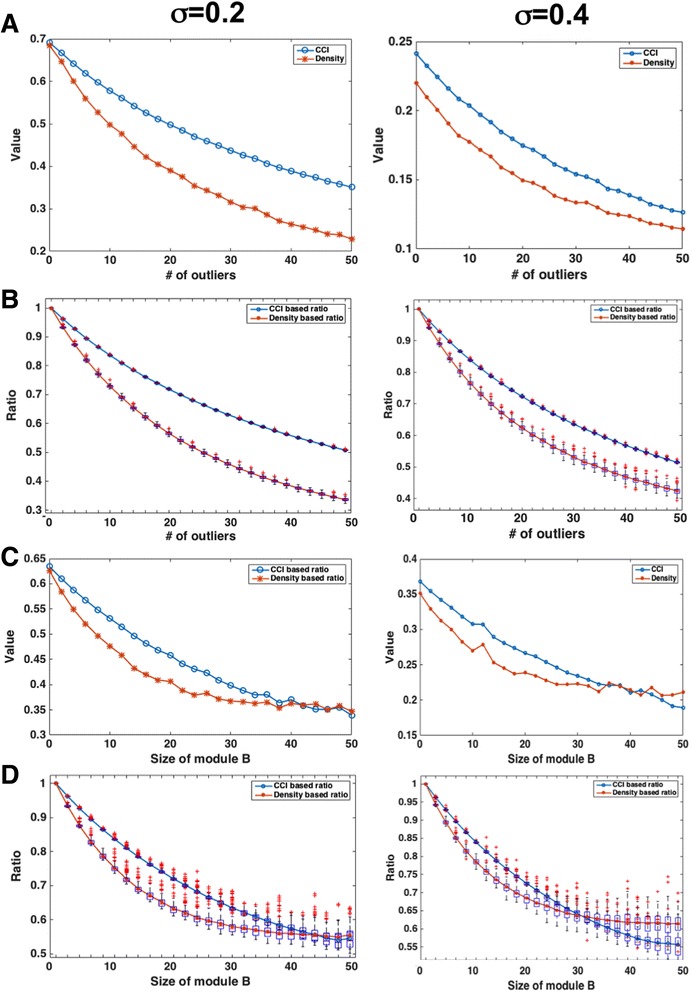
Fig. 2.

Comparison between CCI and density metrics. a The CCI versus density metrics with the increases of number of outliers under two different noise levels. b The boxplots for the two metrics with different number of outliers and noise levels. The values are normalized to the values with zero outlier. c The CCI versus density metrics with the increasing size of the interfering module. d The boxplots for the two metrics with different number of outliers and noise levels with the values normalized to the values without interfering module
