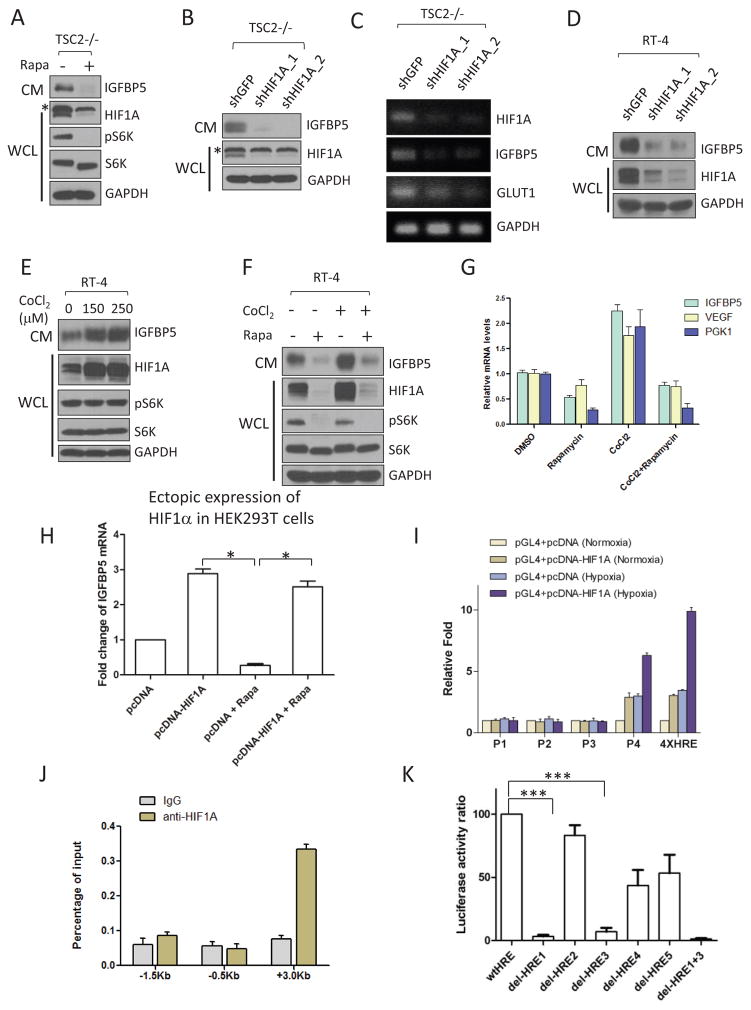
Figure 2.
Expression of IGFBP5 is transcriptionally regulated by HIF1α. (A) Rapamycin treatment (20 nM, 24hrs) of TSC2−/− MEFs led to a concurrent downregulation of HIFα (in WCL) and IGFBP5 (in CM). The asterisk indicates a non-specific band. For site-specific phosphorylation, pS6K(T389) levels were analyzed. (B) and (C) RNAi-mediated knockdown of HIFα in TSC2−/− MEFs led to downregulation of IGFBP5 at both protein (B) and mRNA (C) levels. Glut1 is a known transcriptional target of HIFα, and was used as a positive control. The asterisk indicates a non-specific band. (D) Knockdown of HIF1α in RT-4 cells led to a similar downregulation of IGFBP5 levels in CM. (E) Treating RT-4 cells with a hypoxic-mimetic, CoCl2 (24 hrs with the indicated concentrations), led to stabilization of HIF1α in WCL, and accumulation of IGFBP5 in CM. Concurrent treatment of RT-4 cells with CoCl2 (250 μM) and rapamycin (20 nM) abolished IGFBP5 expression at the protein (F) and mRNA (G) levels. P < 0.05 (two way ANOVA test). n=3 independent biological replicate experiments. Error bars represent s. d. (H) IGFBP5 expression is insensitive to mTORC1 inhibition (rapamycin at 20 nM, 24 hrs) in a HIF1α-ectopic expression system. HEK293T cells were transfected with either a pcDNA-HIF1α or a control vector. IGFBP5 mRNA levels were determined by quantitative RT-PCR. *P < 0.05 (two-tailed Student t-test). n = 3 independent biological replicate experiments; Error bars represent s.d. (I) Luciferase reporter assays indicate that the first intron (designed as P4, see Supplementary Figure 3) of the IGFBP5 gene contains functional HREs. Luciferase activities were normalized to Renella luciferase. Hypoxia was induced by growing the cells in a hypoxia chamber (1% O2). A luciferase reporter construct containing 4X HRE (from Promega) was used as the positive control. P <0.001 (two way ANOVA test). n=3 independent biological replicate experiments. Error bars represent s.d. (J) ChIP qRT-PCR confirmation of the binding between HIF1α and the potential HREs in the P4 region. P <0.001 (two way ANOVA test). n=3 independent biological replicate experiments. Error bars represent s.d. (K) Deletion of HRE1 and HRE3 (Supplementary Figure 3) in the P4 region of the IGFBP5 gene abolishes the binding of HIF1α in the luciferase assay. ***P < 0.001 (two-tailed Student t-test). n = 3 independent biological replicate experiments; Error bars represent s.d.

