Figure 1.
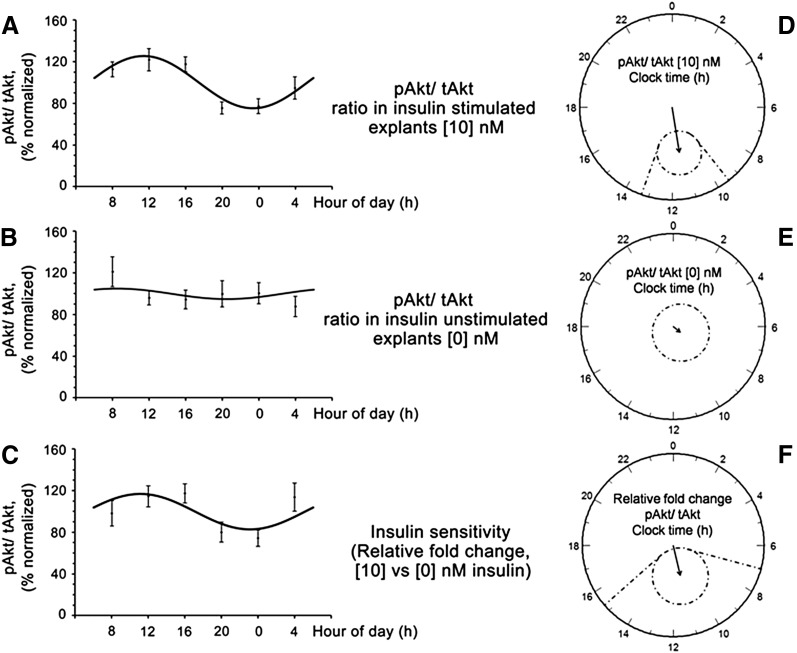
Changes in insulin signaling (pAKT/tAKT) across the day. Subcutaneous AT in stimulated (10 nM) (A) and unstimulated (0 nM) explants (B), and in the insulin sensitivity pattern (relative percentage of change in AKT phosphorylation in insulin-stimulated explants with respect to the unstimulated explants) (C), and their respective polar (clock-like) representations (n = 18) (D–F). Raw data are represented by black dots; solid lines represent fitted 24-h sinusoidal curve of the population. Polar representation of the estimates of the parameters of the rhythm for 0 and 10 nM and insulin sensitivity are also shown. In polar plots, circles represent 24 h and the radius corresponds to 50% units. Vector length is amplitude of the rhythm and it points to its acrophase. Dotted ellipses show the 95% confidence limits for vectors (if the confidence limits include the center, the rhythm is not statistically significant), and straight dotted lines are the corresponding confidence intervals for the acrophases. Least squares periodic regression (12) was used to fit a sinusoidal function to the data; 10 nM (amplitude, 25%; acrophase, 11:23; P < 0.001); 0 nM (amplitude, 5%; P = 0.69); insulin sensitivity (amplitude, 17%; acrophase, 11:06; P = 0.022).

