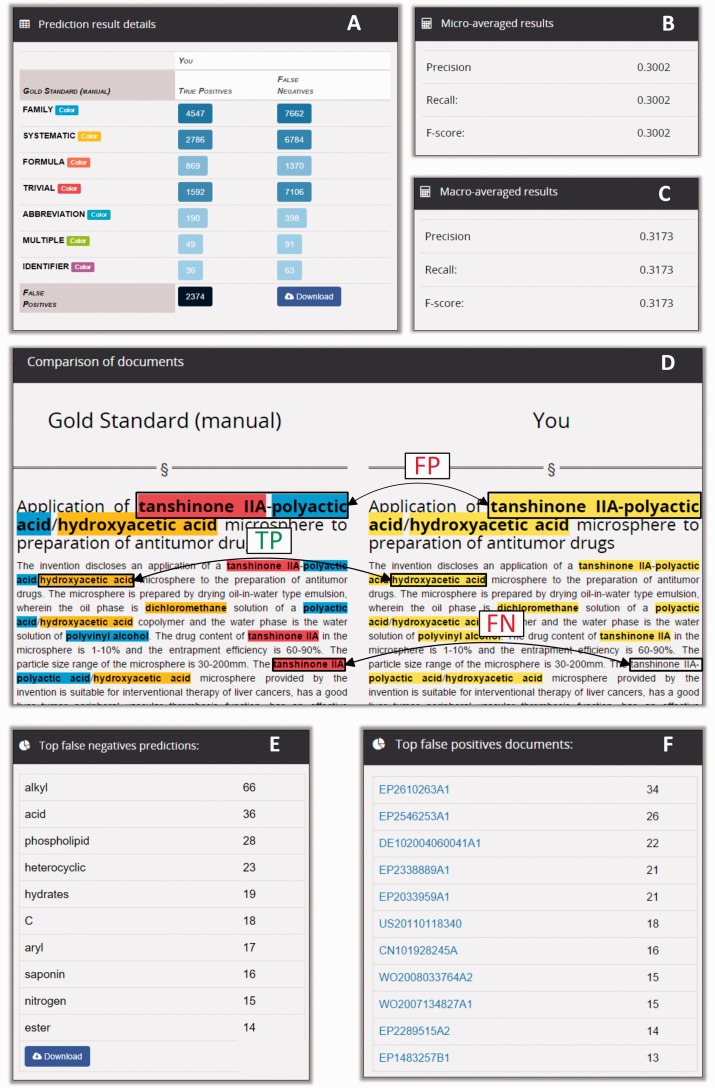
Figure 6.
Snippets of the information displayed in a CEMP prediction analysis report. The report shows the distribution of true positives and false negatives per annotation type (A), and performance is described in terms of macro- and micro-averaged precision, recall and F-score statistics (B and C). The tool enables the exploration of prediction matches and mismatches in individual documents (D). Also, it enables the inspection of the most frequent misclassifications (E) and the documents with more mismatches (F).

