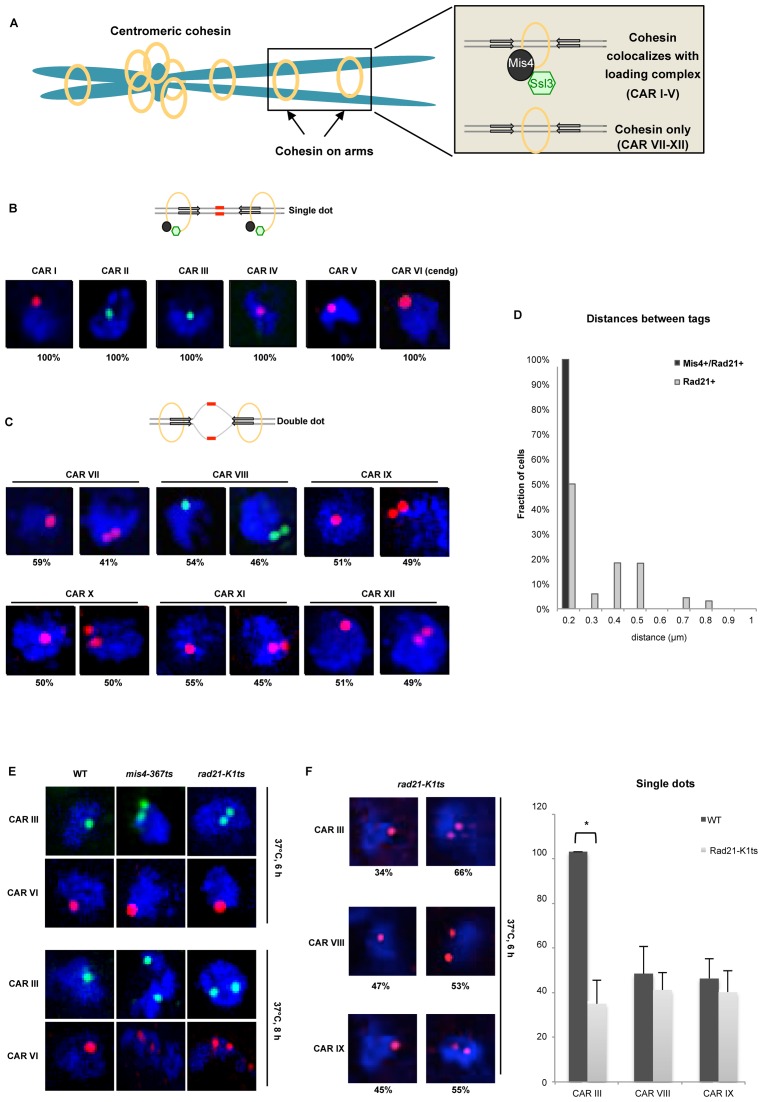
Figure 1.
Cohesive and non-cohesive subsets of cohesin on chromosome arms in S. pombe. (A) An illustration of sister chromatids (blue) held together by the ring shaped cohesin complex (yellow) at centromeres and across the arm regions. The inset depicts cohesin enrichment at intergenic regions between convergent genes (grey arrows) on chromosome arms in S. pombe, wherein cohesin localizes with (top panel) or without (bottom panel) its loader Mis4-Ssl3 (black-green). (B) Top: schematic showing cohesed sister chromatids at Mis4+/Rad21+ sites visualized by DNA-FISH (red probes). Bottom: Single locus specific DNA FISH showing single dots at CARs I to VI (Mis4+/Rad21+ sites) in G2 cells (selected by septation index) (n = 200, three biological repeats). Red (Alexa-555) or green (Alexa-488) probes are shown inside DAPI stained nucleus (blue). (C) Top: schematic showing non-cohesed sister chromatids at Rad21+ sites visualized by DNA-FISH (increased separation between red probes). Bottom: Similar amount (±50%) of single-double dots at CAR VI to XII in G2 cells (selected by septation index) (n = 200, three biological repeats). Red (Alexa-555) or green (Alexa-488) probes are shown inside DAPI stained nucleus (blue). (D) Inter-chromatid distance measurement between sister chromatids at Mis4+/Rad21+ and Rad21+ regions. Z-stacks were converted into 2D images and distances between two spots measured using line scan tool of the ImageJ software. (E) DNA-FISH analysis in wild type (WT), mis4-367ts and rad21-K1ts strains after Mis4 and Rad21 inactivation by shift to 37°C. Top: cohesion at the arms, CAR III (green dots) was destabilized but cohesion at centromeres, CAR VI (red dots) was unaffected after 6 h at 37°C. Bottom: defective arm (CAR III) and centromeric cohesion (CAR VI) after 8 h at 37°C. Arm and centromeric cohesion was unaffected in WT throughout (n = 100 cells). (F) DNA-FISH analysis in rad21-K1ts strains after Rad21 inactivation by shift to 37°C. CARs III, VIII and IX were analyzed. Cells showing single or double dots were counted and plotted in a bar graph. * P < 0.05, two-tailed, paired Student's t-test, Error bars represent SD, n = 3.

