Figure 5.
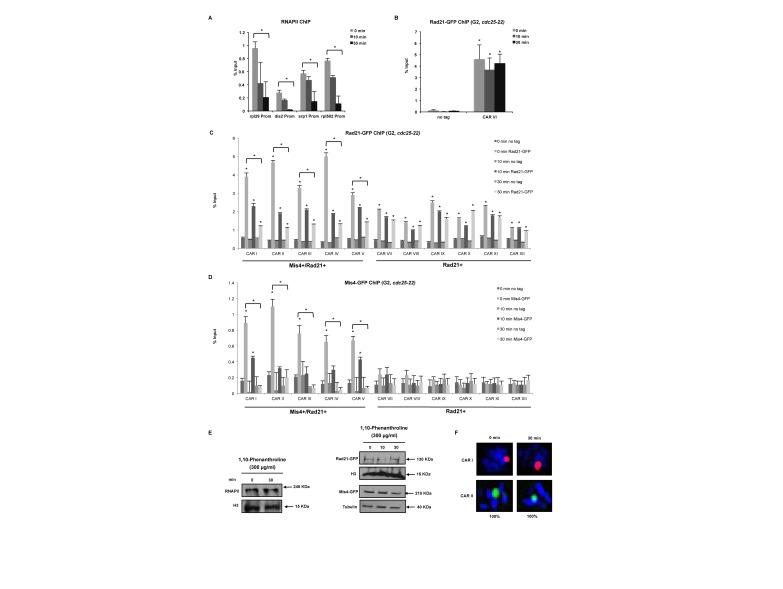
Transcription inhibition reduces chromatin association of cohesin proteins. (A) ChIP-qPCR analysis showing RNAPII occupancy after 1,10-phenanthroline treatment (300 μg/ml, 10 and 30 min) at selected promoters. *P < 0.05, two-tailed, paired Student's t-test between 0 and 30 min. Error bars represent SD, n = 3. (B) ChIP-qPCR analysis showing Rad21-GFP enrichment at CAR VI after 1,10-phenanthroline treatment (300 μg/ml, 10 and 30 min) in G2 synchronized cells (cdc25-22, 37°C 4 h). No tag strain was used to assess the background levels. *P < 0.05, two-tailed, paired Student's t-test for Rad21-GFP compared to background levels. Error bars represent SD, n = 3. (C) ChIP-qPCR analysis as in (B) at selected CARs. (D) ChIP-qPCR analysis as in (C) showing Mis4-GFP enrichment at selected CARs (E) Western blot showing RNAPII, Rad21-GFP, Mis4-GFP, H3 and tubulin protein levels after transcription inhibition using 1,10-phenanthroline (300 μg/ml, 30 min). Total RNAPII was probed with 8WG16 (ab817), Rad21 and Mis4 with anti-GFP (ab290) and histone H3 with anti-H3 (ab1791) antibody. (F) DNA-FISH analysis of CARs I and II after 1,10-phenanthroline treatment (300 μg/ml, 30 min).

